Remember how we always say diversification is key? The past three months have proved exactly why. Just a quarter ago, our asset quilt showed gold leading the charts with 25% gains through H1 of 2025. Fast forward to now, silver has stolen the spotlight, soaring 68% so far this year.
In this edition, we dive into how major asset classes have performed over the years. We then highlight the top and bottom performers in Q3 2025, as well as the road ahead. We also examine where India currently stands in the macroeconomic cycle. The goal is to help guide allocation decisions by understanding how asset performance has varied across different phases.
| Top Investment Takeaways |
|---|
| → Given India is in a transitory slowdown phase, avoid aggressive equity allocation. Use SIPs and increase exposure only as recovery signals strengthen. |
| → Rebalance portfolio as macroeconomic phases evolve. Move gradually toward growth-oriented assets as the Strong Recovery phase emerges. But, increase equity allocations only as cyclical signals improve. |
| → Allocate to short-to medium-duration debt funds. We expect the RBI to cut rates by 50 bps by FY26. This will make the segment attractive for stable returns. |
| → Consider yield-generating assets such as Indian REITs & InvITs. They may benefit from SEBI reforms and increasing institutional interest. |
| → Maintain gold exposure at 5-10% via ETFs. Gold performs best during sharp slowdowns. Given the recent rallies, avoid lump-sum purchases of gold and silver, and prioritise staggered buys. |
| → Prioritise diversification. Asset leadership shifts quickly, gold led early in H1 2025, and silver has now surged 68%. |
Behind the Scenes of the Top-Performing Asset
Ever wondered why no asset class stays at the top every year? Just look at 2020. Bitcoin stole the show, returning over 312%. That was the year when central banks flooded markets with liquidity after the COVID-19 lockdowns. This sent investors chasing the riskiest assets.
Fast forward to 2021, and it's Indian smallcaps that gained. This was due to economic reopening, big fiscal stimulus, and a burst of retail investor enthusiasm. But leadership changes quickly. Indian smallcaps, which rose in 2021, lagged two years earlier. Why? They’re more sensitive to sentiment swings and external risks.
| 2018 | 2019 | 2020 | 2021 | 2022 | 2023 | 2024 | 2025 (to date) | Last 5Y CAGR |
|---|---|---|---|---|---|---|---|---|
Gold 8% | BTC 98% | BTC 312% | BTC 62% | Silver 15% | BTC 154% | BTC 129% | Silver 68% | BTC 66% |
Debt 7% | DME 28% | Silver 52% | Smallcap 62% | Gold 11% | Smallcap 48% | Gold 31% | Gold 53% | Smallcap 27% |
Real Estate 6% | Gold 21% | Gold 28% | Midcap 47% | Real Estate 9% | Midcap 44% | Smallcap 26% | BTC 26% | Midcap 27% |
Lg Cap 3% | Silver 18% | Smallcap 25% | Lg Cap 24% | REITs & InvITs 9% | DME 22% | Silver 25% | REITs & InvITs 24% | Gold 20% |
Silver 0% | Real Estate 13% | Midcap 24% | DME 22% | Debt 5% | Lg Cap 20% | Midcap 24% | DME 20% | Silver 19% |
DME -2% | Lg Cap 12% | DME 17% | REITs & InvITs 18% | Cash 5% | Gold 14% | DME 21% | Real Estate 10% | DME 17% |
Midcap -13% | Debt 9% | Lg Cap 15% | Real Estate 9% | Lg Cap 4% | Debt 8% | REITs & InvITs 16% | Debt 6% | Lg Cap 17% |
Smallcap -27% | REITs & InvITs 9% | Real Estate 10% | Debt 4% | Midcap 3% | Cash 7% | Real Estate 14% | Cash 4% | REITs & InvITs 16% |
BTC -72% | Cash 6% | Debt 9% | Cash 3% | Smallcap -4% | Real Estate 6% | Lg Cap 9% | Lg Cap 4% | Real Estate 11% |
Midcap 0% | REITs & InvITs 6% | Gold -2% | DME -10% | REITs & InvITs 1% | Debt 8% | Midcap 0% | Debt 7% | |
Smallcap -8% | Cash 3% | Silver -10% | BTC -60% | Silver 0% | Cash 7% | Smallcap -6% | Cash 5% |
Data as of Sep 30, 2025
Please note that the returns shown in the Asset Allocator Quilt are calculated in Indian Rupee (INR) terms on a calendar year basis. The 5-year CAGR is calculated for the period from September 2020 to September 2025.
| Abbr. | Asset Class | Index |
|---|---|---|
| Lg Cap | Indian Large Cap Equities | Nifty 50 |
| Midcap | Indian Midcap Equities | Nifty Midcap 150 |
| Smallcap | Indian Smallcap Equities | Nifty Smallcap 250 |
| Real Estate | Indian Residential Real Estate | 1 Finance Housing TRI |
| REITs & InvITs | Indian REITs & InvITs | Nifty REITs & InvITs TRI |
| Gold | Gold | XAU/USD (INR terms) |
| Silver | Silver | XAG/USD (INR terms) |
| BTC | Bitcoin | Bitcoin (INR terms) |
| DME | Developed Market Equities | MSCI World Index (INR terms) |
| Debt | Debt | Aditya Birla SL Liquid Fund(G), ICICI Pru All Seasons Bond Fund(G), ICICI Pru Short Term Fund(G). |
| Cash | Cash | Nifty 1D Rate Index |
Silver’s story is equally dramatic. It enjoyed strong gains in both 2022 (thanks to mining disruptions and safe-haven demand) and now in 2025, as industrial demand skyrockets. Notice how silver also tends to rise when gold does, echoing their close correlation. This year, it’s metals like silver and gold grabbing all the attention, not Indian equities.
Recommended for you
Readers also explored
Asset Correlation: A Guide to Better Portfolio Diversification

Nifty 50 Companies List 2025 : Top 50 Stocks in India
Q3 2025 Brings Mixed Returns Across Asset Classes
Now let's look at which assets performed well in Q3 2025. Silver has stolen the spotlight, topping the charts among major asset classes. In Q3 alone, the metal delivered nearly 35% returns. What drove this rally? Industrial demand increased even as supply remained tight. Meanwhile, investor participation increased with strong inflows into silver-backed ETFs.
What's really surprising is the strong showing from Indian REITs & InvITs. The asset class has provided a steady 12% return in Q3. This rally is powered by recent SEBI reforms, especially reclassifying REITs as 'equity' for MFs. That move has widened the investor base, leading to better liquidity and greater participation.
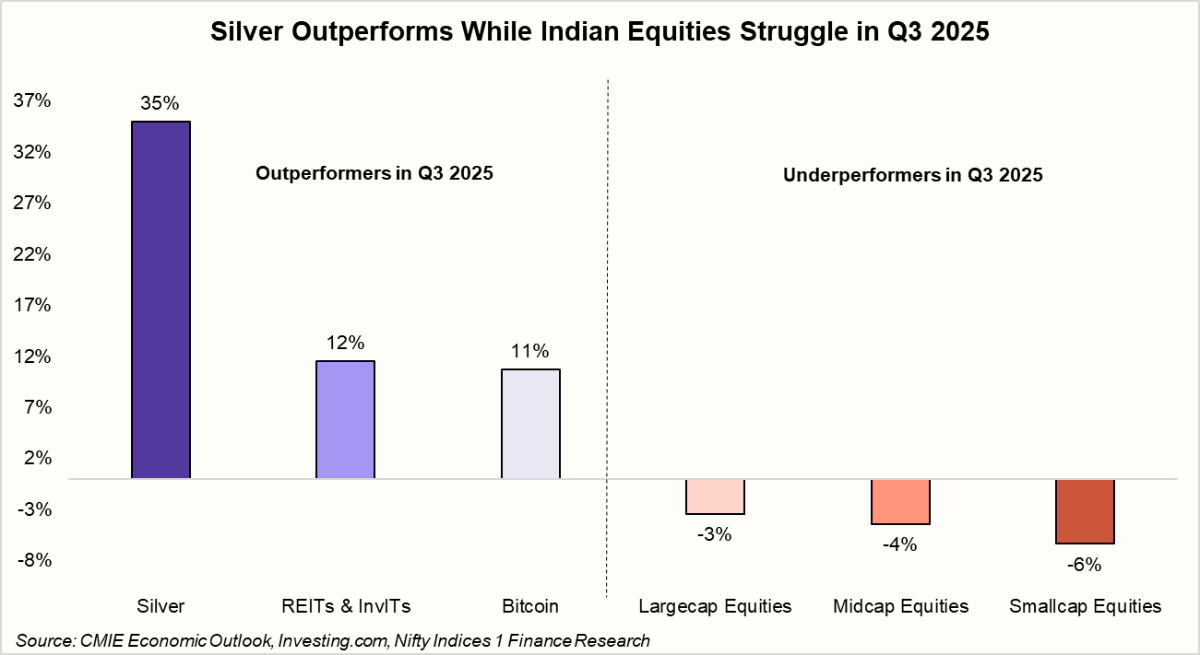
However, Indian Equities were significant underperformers across major asset classes in Q3 2025. This was due to major external challenges that arose. For example, President Trump increased fees on H-1B visas. He also announced new 100% tariffs on pharmaceutical imports. Moreover, heavy Foreign Institutional Investment (FII) outflows added further pressure on the market. This performance highlights the importance of diversifying across asset classes.
How India’s Macroeconomic Phases Shape Asset Performance
Now that we’ve seen why diversification matters, the next step is to understand how to diversify. The economic backdrop plays a big role here. Asset classes don’t perform uniformly across every phase of the economy. Some do well in strong growth, while others hold up better in slowdowns.
To see this better, we looked at how Indian asset classes moved through past macro phases. For this analysis, we used the 1 Finance Macroeconomic Index (1FMI). This index uses key high-frequency indicators to show where the economy stands.
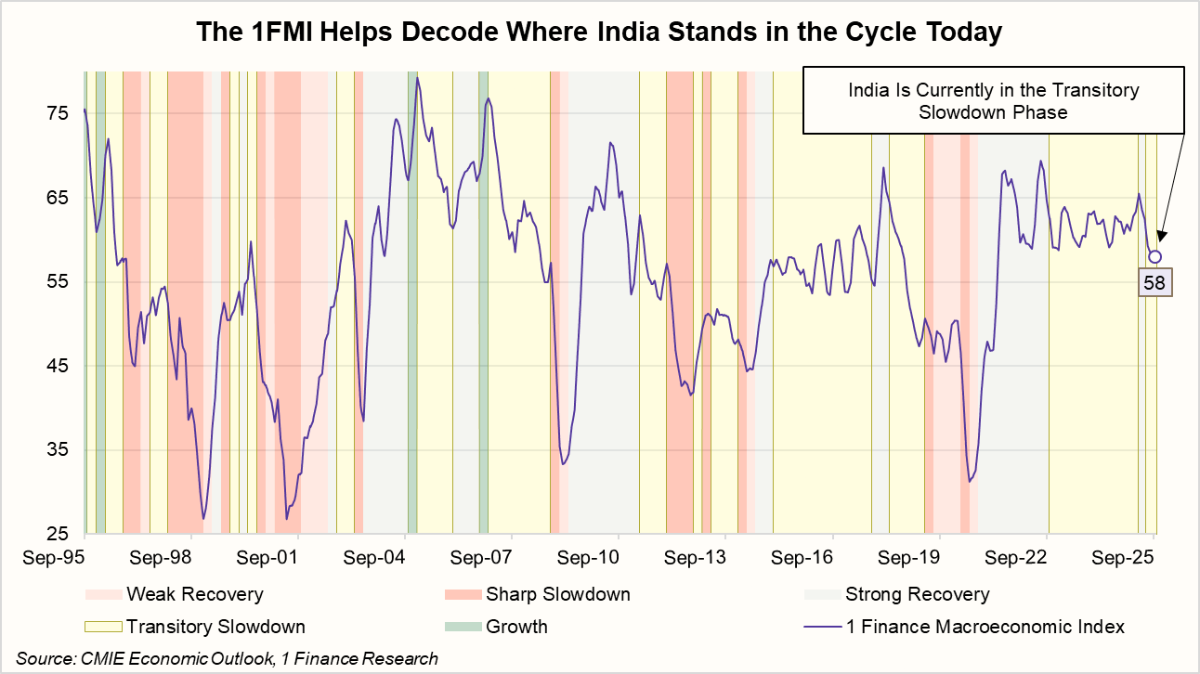
There are six major macroeconomic phases: Growth, Strong Recovery, Weak Recovery, Transitory Slowdown, Sharp Slowdown, and Recession. India is currently in the Transitory Slowdown phase.
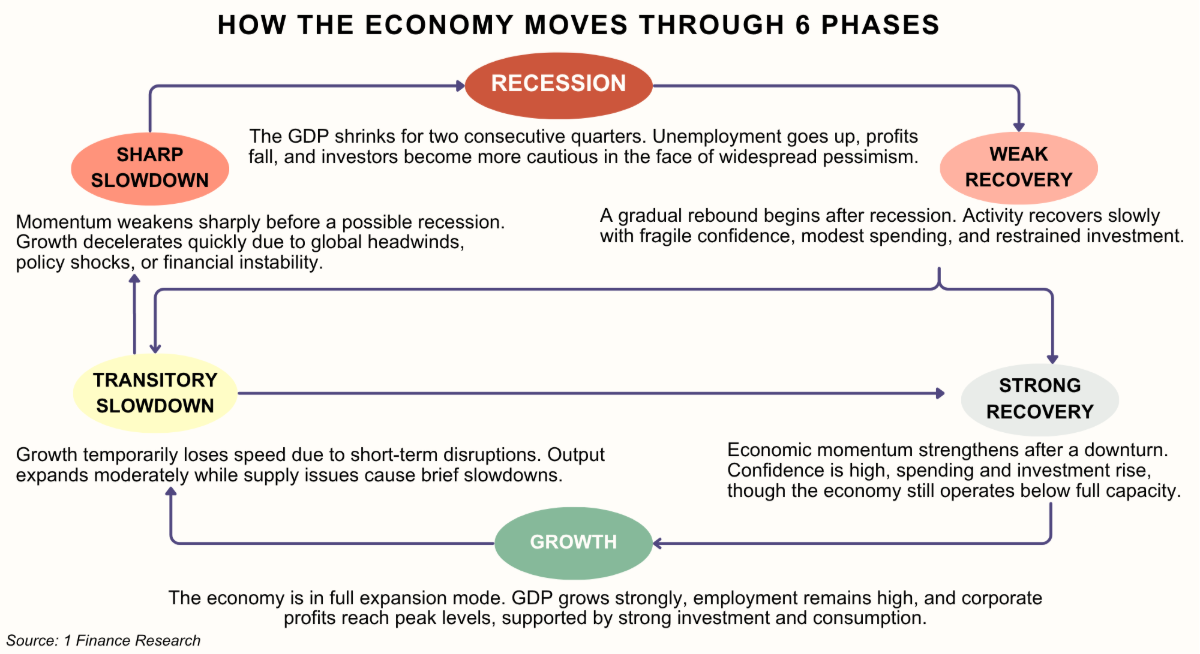
So, here’s the interesting part: how often has India actually been in each of these phases? The good news is, India has never slipped into recession. Between January 1991 and September 2025, the economy spent the most time, about 44% of the period, in a Transitory Slowdown.
| Category | Growth | Strong Recovery | Weak Recovery | Transitory Slowdown | Sharp Slowdown | Recession |
|---|---|---|---|---|---|---|
| Proportion of Time India Spent in Phase | 3% | 25% | 11% | 44% | 17% | 0% |
| Longest Period | Jul-95 to Mar-96 | Oct-20 to Sep-22 | Jul-19 to Mar-20 | Jan-15 to Sep-17 | Jan-98 to Dec-98 | - |
Data as of Sep 30, 2025
The longest stretch in this phase was from January 2015 to September 2017. Strong Recovery accounted for around 25% of the time. Interestingly, India has experienced a true Growth Phase only 3% of the time. The longest period of the Growth Phase was between July 1995 and March 1996. Sadly, the last real phase of strong growth was way back in 2006.
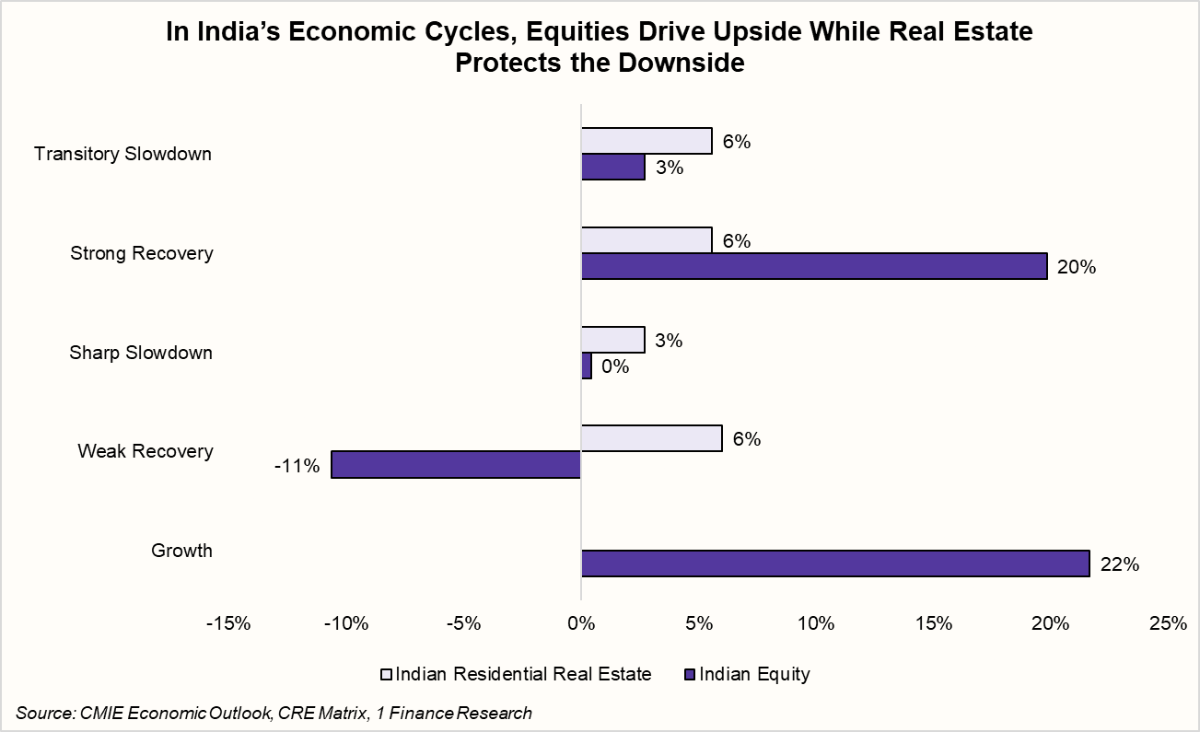
Note: Returns are expressed as CAGR for each asset class across India’s distinct macroeconomic phases during the period from January 1991 to September 2025. Returns shown use the following proxies: Nifty 500 (Indian Equity) and 1 Finance Housing Total Return Index (Indian Residential Real Estate).
Indian equities have delivered strong returns during growth and strong recovery phases. They compounded around 22% annually in expansion years. Meanwhile, India’s residential real estate adds stability and tends to perform well during recovery periods. This makes the combination a powerful diversifier.
But history also tells us that equities often struggle during a transitory slowdown like the one we’re in now. It’s a reminder that spreading investments across asset classes helps manage such phases.
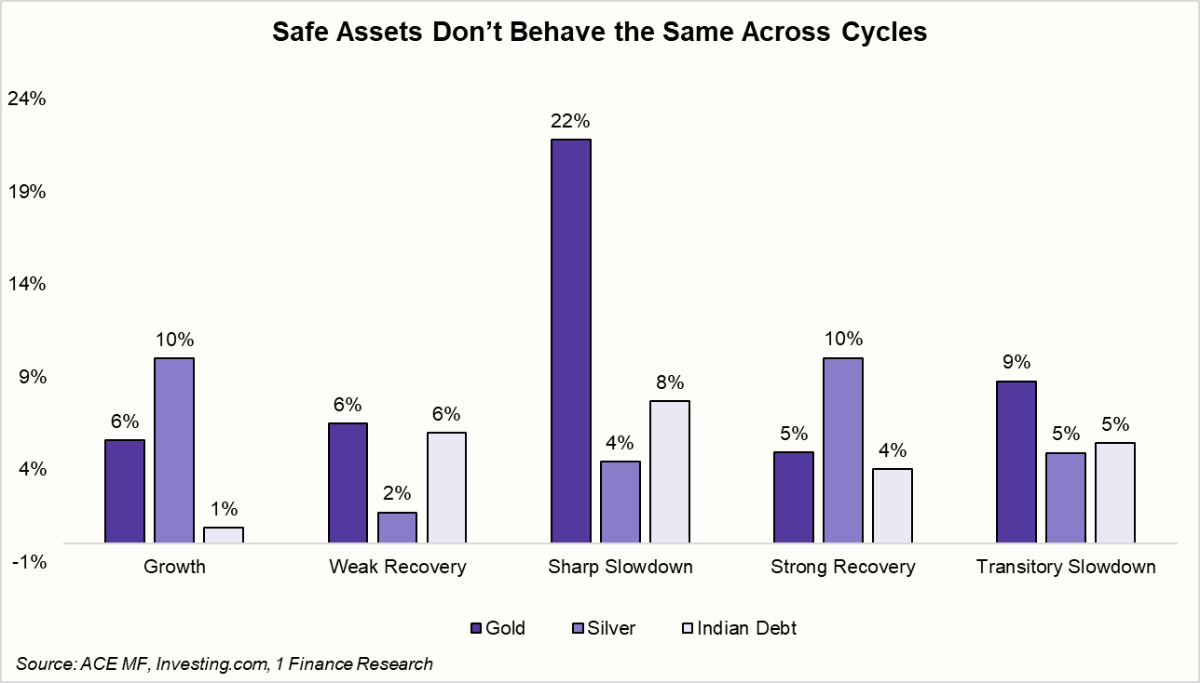
Note: Returns are expressed as CAGR for each asset class across India’s distinct macroeconomic phases during the period from January 1991 to September 2025. Returns shown use the following proxies: XAU/USD in INR terms (Gold), XAG/USD in INR terms (Silver) and Select Indian Debt Mutual Funds (Indian Debt).
When the economy hits a sharp slowdown, safe havens tend to shine. Gold usually leads with about 22% annual returns in such years. While Indian debt also holds up well and often beats equities. Meanwhile, silver, thanks to its industrial demand, performs best during Strong Recovery and Growth phases.
This means that asset allocation should follow the broader economic context, not short-term trends. In Strong Recovery phases, higher equity exposure aligns with stronger fundamentals and earnings. During slowdowns, quality debt offers better stability and income.
So, What to Keep in Mind When Investing in the Current Phase?
India’s economy is currently in a transitory slowdown phase. After such a phase, the economy shifts either toward a sharp slowdown or a strong recovery. We expect India to move toward a strong recovery next. The RBI has already undertaken several measures. This includes GST reforms, 22 banking reforms, tax cuts, and 100 bps of rate cuts. These actions are expected to boost consumption, revive credit growth, and support private capital expenditure. Moreover, we project India’s GDP growth at 6.8% in FY26.
So, how should one allocate investments right now? Since we are in a transitory slowdown, it’s prudent not to over-allocate to equities yet. Meanwhile, the debt segment remains relatively attractive. We expect the RBI to cut rates by around 50 bps by FY26, which supports short- to medium-duration debt funds.
Investors may also consider yield-generating assets. SEBI’s recent reforms for REITs & InvITs could encourage stronger institutional participation. In the case of precious metals, gold tends to perform best during sharp slowdowns. It is advisable to maintain 5-10% exposure to gold through ETFs. After recent rallies, avoid lump-sum investments in both gold and silver.
Going forward, with a high probability that India will move toward a strong recovery, asset allocation should gradually tilt toward growth-oriented segments. Use our Asset Allocator to run this kind of analysis. It shows what an ideal allocation could look like for an investor based on their age and the current economic cycle.