Introduction
This quarter, India’s housing market told a very different story than expected. The numbers back it up: in Q2 2025, India’s housing market stayed strong despite a flood of new launches, with sales crossing ₹1,61,859 crore. In this edition, we cut through the noise to unpack the big picture: sales, supply shifts, city-level trends, and what they mean for investors.
How Has the Indian Housing Market Performed So Far?
The 1 Finance Housing Total Return Index, India’s first unbiased housing index based on RERA-registered transaction data, captures housing trends through a weighted methodology of PSF rate, rental yield, and population. Over the past 5 years, the index delivered a solid 10% CAGR, with a sharp 17% YoY jump last year.
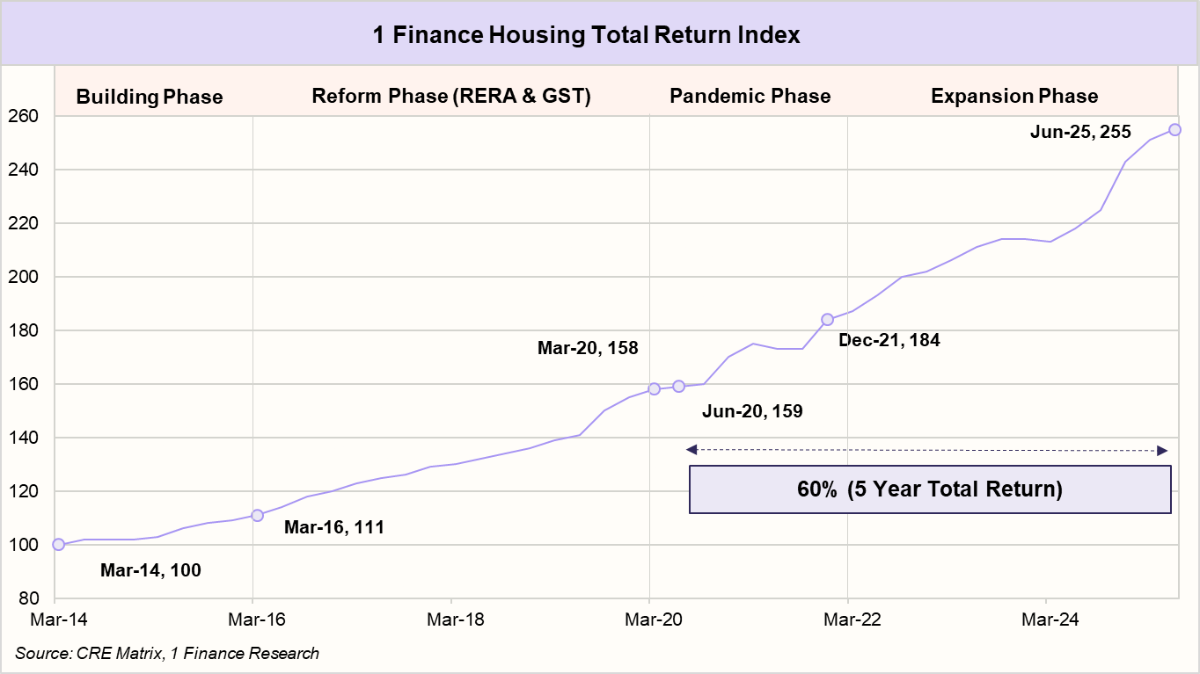
What’s driving the momentum this quarter? Prices now reflect genuine end-user demand, not speculation — a sign of a healthier market. Add to that, infrastructure upgrades like metro lines, expressways, and airports are fueling demand in peripheral areas.
Which Cities Struck the Best Balance in Q2 2025?
At the city level, performance was mixed. Markets like Greater Mumbai and Pune continued to see strong absorption, while supply outpaced demand in Delhi NCR, Hyderabad, and Bengaluru, pushing inventory levels higher.
Greater Mumbai
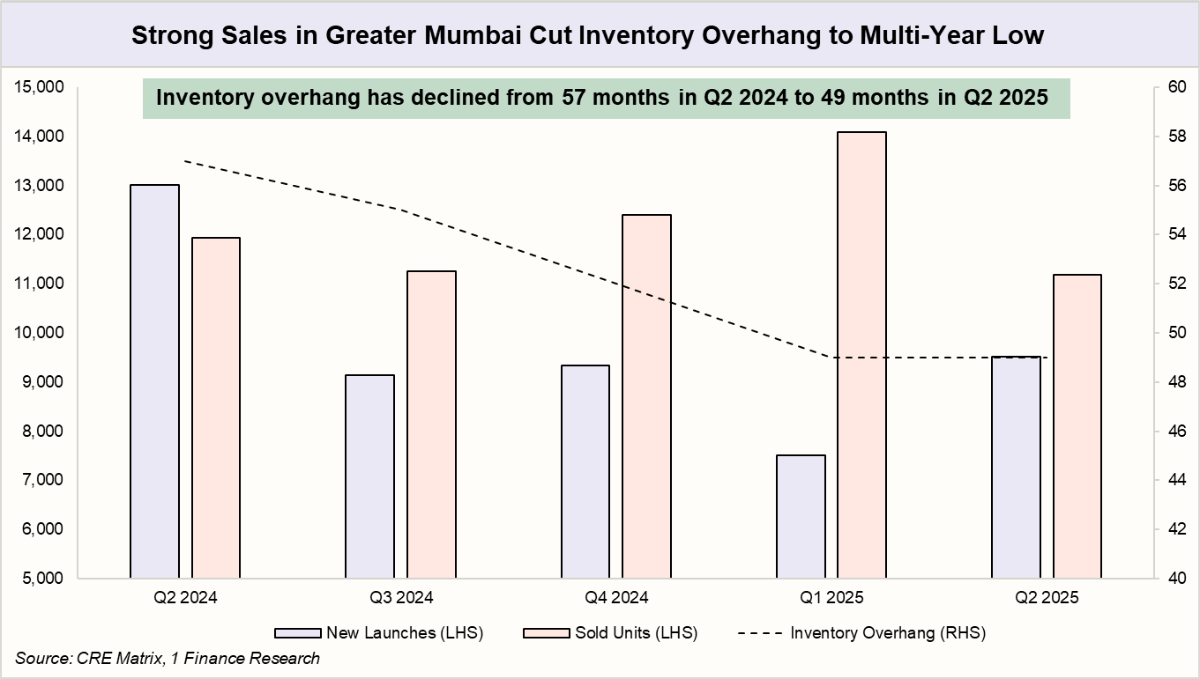
Greater Mumbai’s housing market continues to hold its ground. Despite the city’s well-known challenges, steady end-user demand and investor interest are supporting the market, as seen in the inventory overhang easing from 57 months in Q2 2024 to 49 months in Q2 2025.
Note: Inventory overhang is the time (in months) it would take to clear unsold housing stock at the current sales pace.
Recommended for you
Readers also explored
Housing Cycle in India: Recovery, Expansion, Hypersupply, Recession

India's IT Sector Outlook for FY2026
Pune
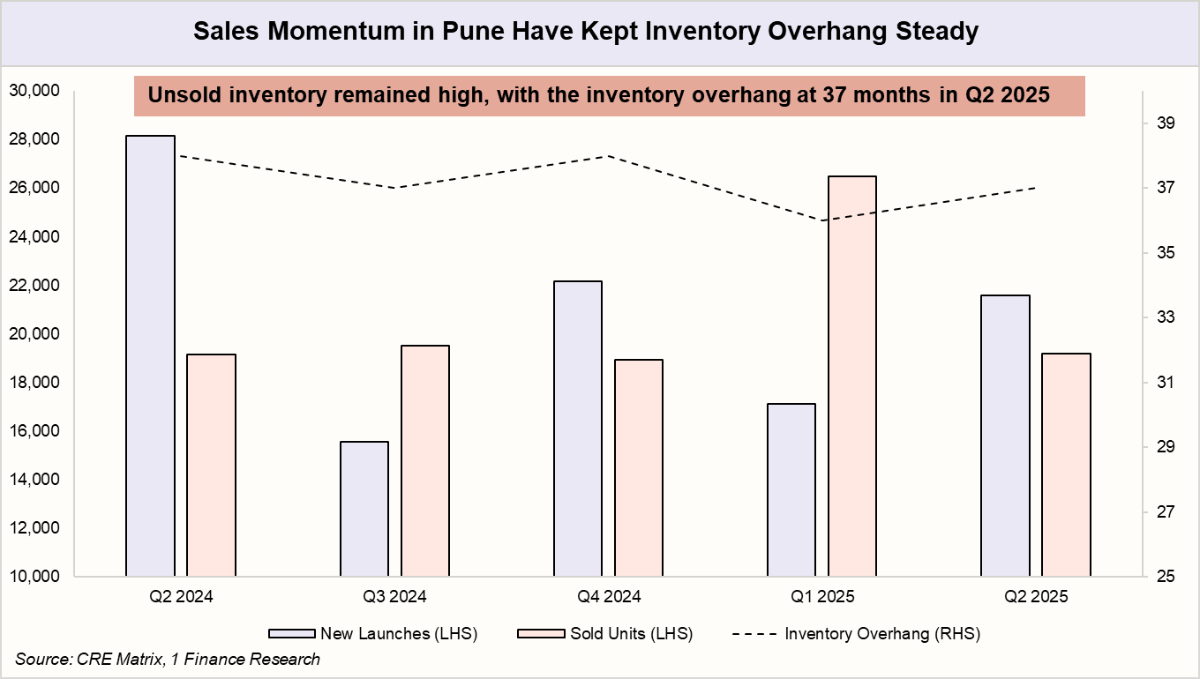
Pune’s housing story continues to be shaped by its thriving IT backbone. The city remains one of India’s fastest-growing markets, with demand from professionals fueling steady momentum. In Q2 2025, new launches rose to 21,597 units, up from 17,111 in Q1. Sales eased to 19,179 units from 26,476 in the previous quarter, reflecting a market that is recalibrating but still anchored in strong end-user demand.
Thane
Thane, once seen as a quiet suburban outpost of Mumbai, is coming up to be an integral hub of the Mumbai Metropolitan Region (MMR). Yet, the latest numbers point to a cooling phase; inventory overhang climbed to 75 months in Q2 2025 (up from 72 in Q1), the highest among major metros. New launches surged to 22,894 units compared to 13,681 in Q1, while sales slipped to 12,860 units from 16,238 in the previous quarter.
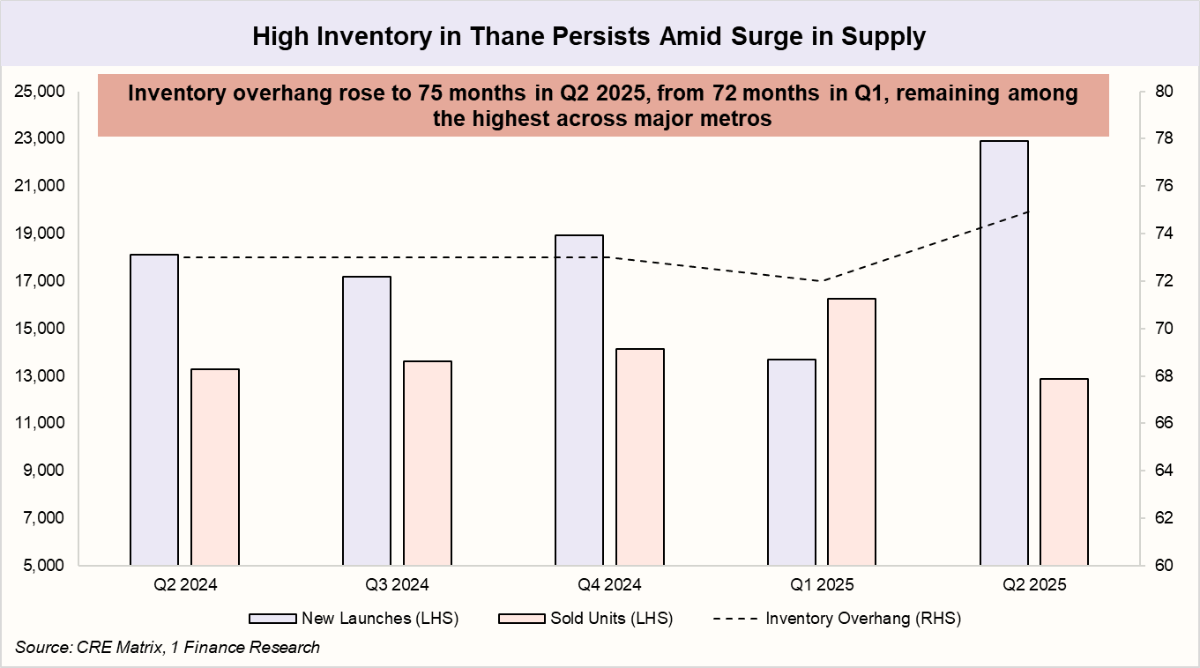
Delays in public infrastructure and rising inventory levels have created a short-term slowdown in Thane, with the trajectory now hinging on timely delivery, absorption, and pricing discipline.
Hyderabad
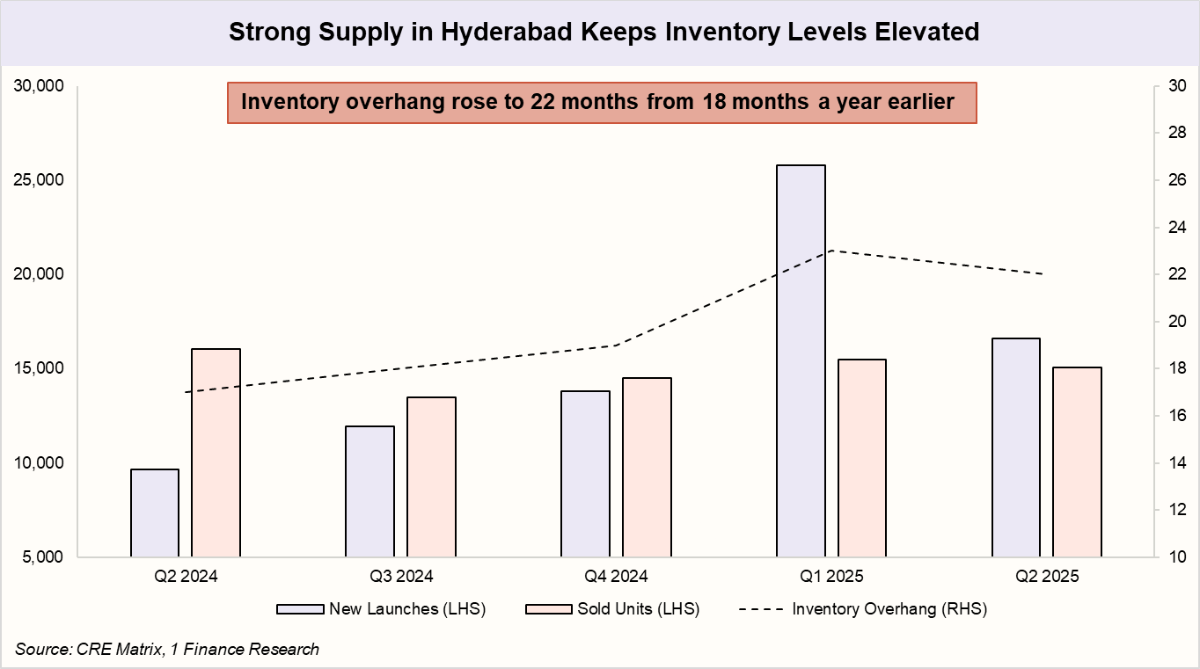
Hyderabad, buoyed by its robust economy and thriving job market, saw 16,604 new housing units launched in Q2 2025, down from 25,779 in Q1, yet it remains the top metro for new supply. Sales held strong at 15,088 units, with 3 BHK homes continuing to drive demand.
Bengaluru
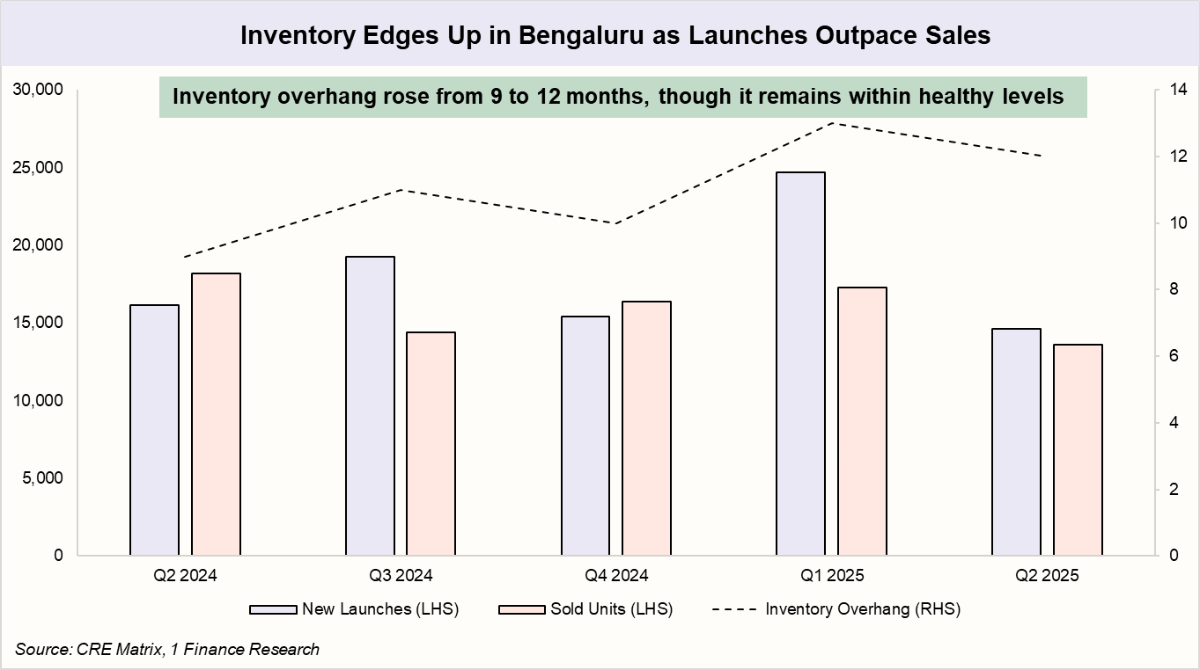
Bengaluru, India’s tech hub, saw 14,639 new housing units launched in Q2 2025, down from 24,667 in Q1, with the Southeast and Northeast corridors driving 13,572 sales. 3 BHK units accounted for 52% of demand. While inventory overhang has risen, it remains within healthy levels.
Chennai
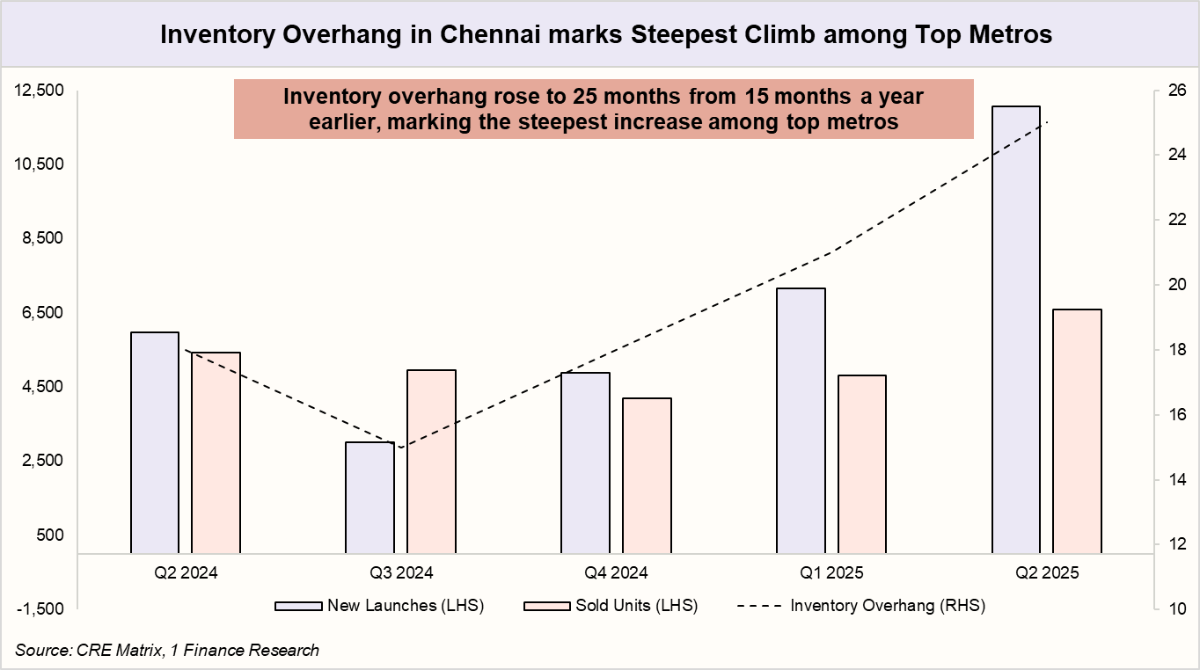
Chennai, a key IT/ITeS hub, is benefiting from ongoing infrastructure upgrades that enhance citywide accessibility. However, growth momentum has eased recently. Inventory overhang surged to 25 months (from 15 last year), marking the steepest increase among top metros. Q2 2025 saw 12,061 new launches, led by Chengalpattu, while sales rose to 6,595 units, with 3 BHKs driving demand.
Kolkata
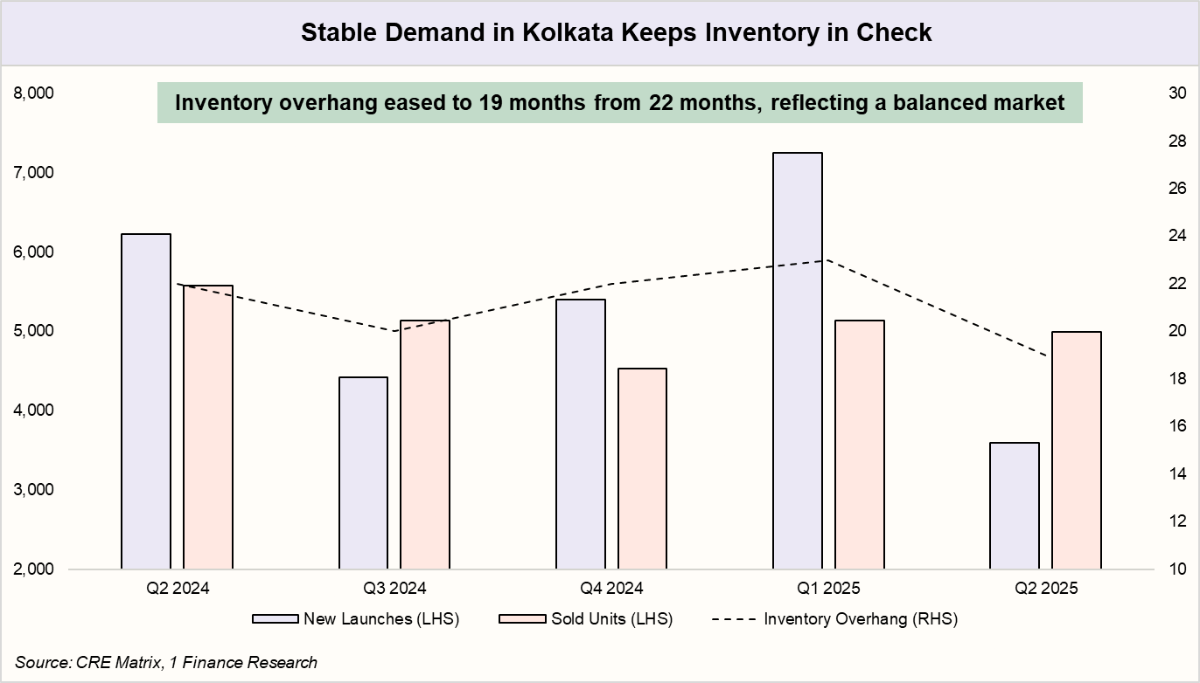
Kolkata’s real estate market stayed balanced in Q2 2025. New launches dropped to 3,590 from 7,253 in Q1, yet sales remained steady at 4,994 units. Driven mostly by end-user demand, 2 BHK and 3 BHK flats made up 85% of transactions, signalling a healthy, well-paced market.
Delhi NCR
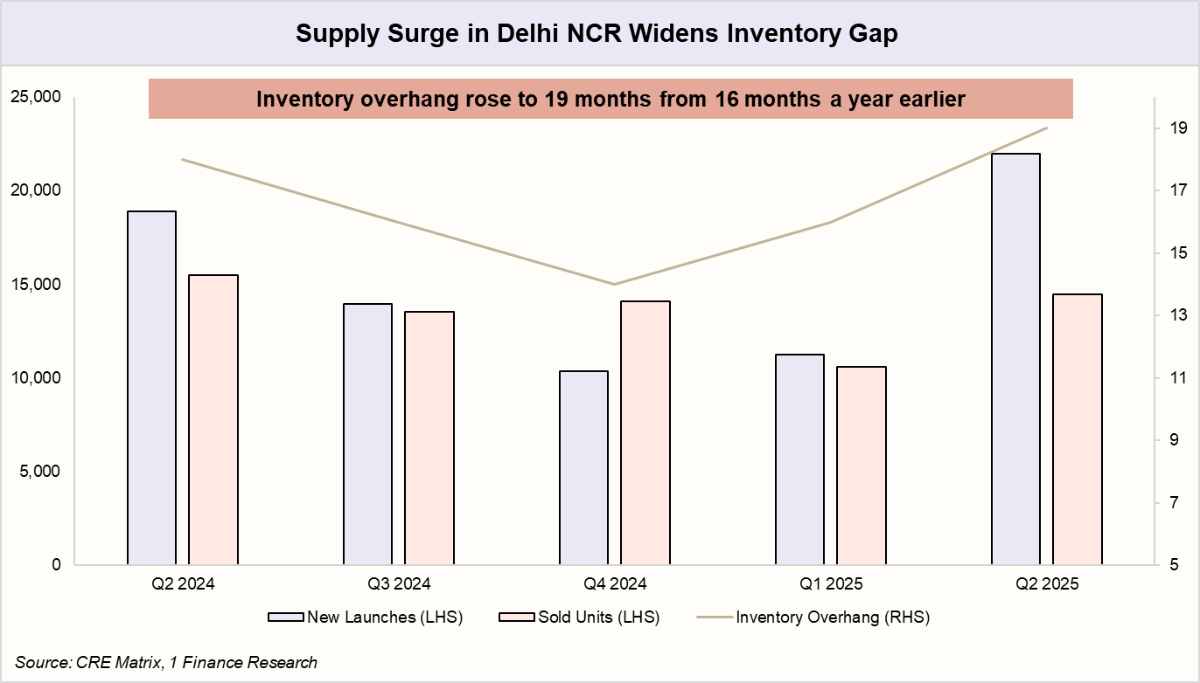
Delhi NCR has delivered the strongest capital growth over the past five years, fueled by high-value launches and active investor interest. In Q2 2025 alone, the region recorded 22,001 new units, almost double the 11,251 launched in Q1.
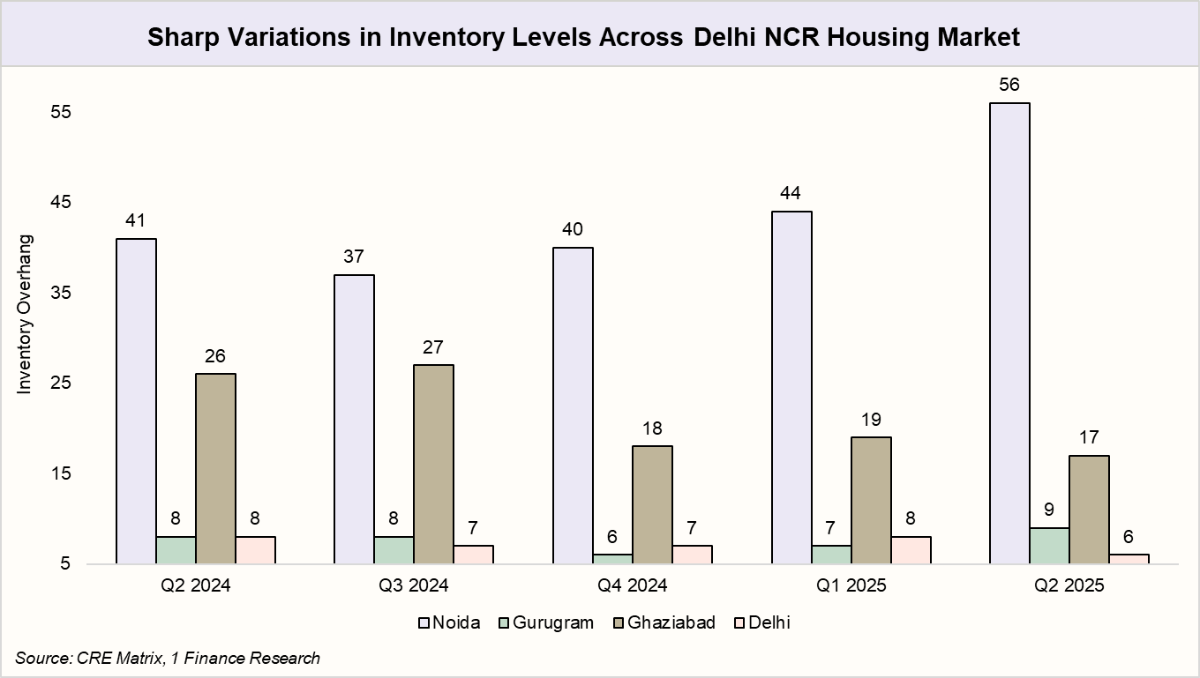
A closer look at regional data reveals sharp sub-market disparities, with inventory overhang ranging from 9 months in Gurugram to 56 months in Noida. At the same time, Ghaziabad, Greater Noida, and Gurugram emerged as the key drivers of new launch activity in Delhi NCR during Q2 2025.
India’s Real Estate at a Glance
Real estate rewards patience, research, and precision. Approached systematically, it’s more than a home; it’s a strategic portfolio asset balancing growth, income, and lifestyle. Here’s a city-wise snapshot of prices, sales, and momentum this quarter, with top-performing areas in each city.
| City | Avg PSF rate* | 5 Year CAGR | YoY Growth in Per Sq. Ft | Total sales value Q2 2025 | Top Performing Area |
|---|---|---|---|---|---|
| Greater Mumbai | ₹33,272 | 8.1% | 8% | ₹25,885 Cr | South Mumbai (8% YoY) |
| Pune | ₹11,083 | 8.2% | 8% | ₹14,496 Cr | Central Pune (17% YoY) |
| Thane | ₹13,144 | 7.1% | 4% | ₹8,461 Cr | Thane City (9% YoY) |
| Hyderabad | ₹8,662 | 8% | 7% | ₹28,495 Cr | North West Hyderabad (9% YoY) |
| Bengaluru | ₹10,206 | 10.7% | 6% | ₹22,222 Cr | Central Bengaluru (17% YoY) |
| Chennai | ₹8,708 | 4.5% | 10% | ₹7,269 Cr | Kancheepuram (17% YoY) |
| Kolkata | ₹7,574 | 8.4% | 9% | ₹4,132 Cr | Howrah (17% YoY) |
| Delhi NCR | ₹16,405 | 15.1% | 15% | ₹50,898 Cr | Delhi (47% YoY) |
Note: The Avg PSF Rate for Greater Mumbai is calculated on a carpet area basis, whereas for all other cities, it is on a super built-up area basis. YoY growth is as per the PSF rate, and 5-year CAGR is as per the "Total Return Index" of each city.
Residential Real Estate as an Asset Class
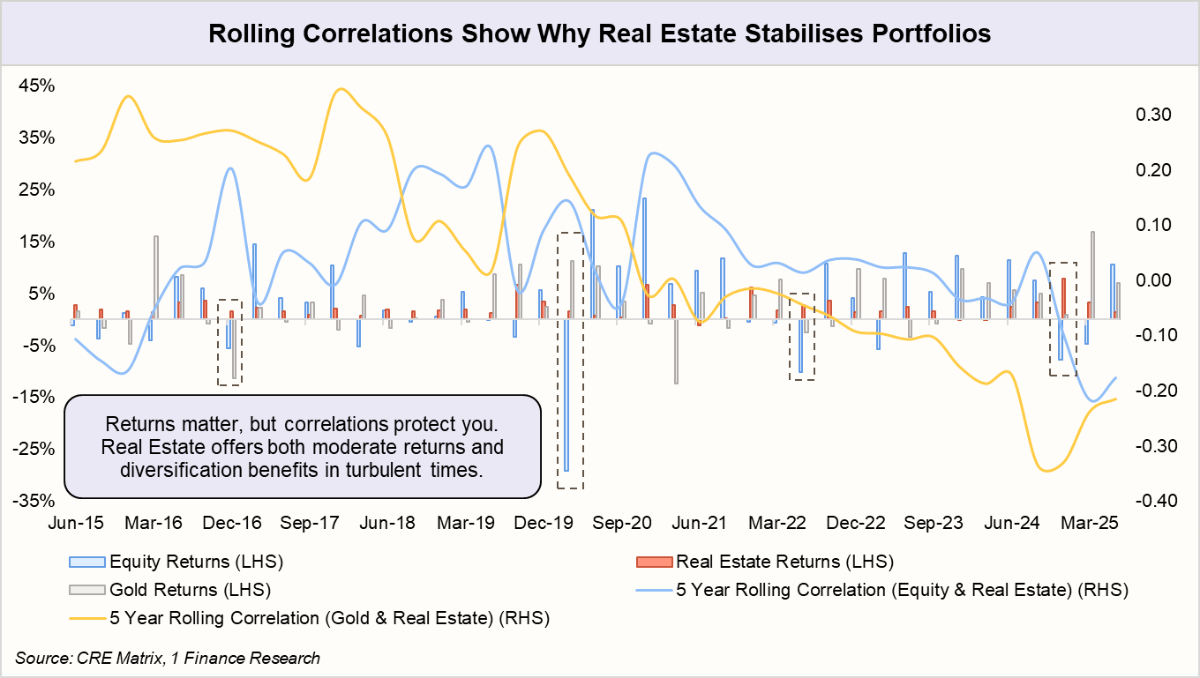
Residential real estate should be part of Indian portfolios for diversification and stability, but exposure needs to be balanced given its liquidity constraints and elevated valuations, to avoid over-concentration and maintain financial flexibility. Our analysis shows that real estate has a low correlation with other major assets, with a long-term correlation of just 0.03 with gold and -0.09 with equity — alongside a compelling reward-to-risk ratio of 2.4 times. In simple terms, real estate doesn’t just diversify a portfolio; it strengthens it.
Our Outlook on India’s Housing Market
India’s housing market has moved past the post-COVID surge and is now entering a phase of steady, demand-led growth. Infrastructure upgrades and potential GST reforms could ease costs and improve affordability, supporting both developers and buyers.
That said, elevated supply in some markets could temper price appreciation, while rising construction costs and regulatory changes may impact affordability and buyer sentiment. Global economic volatility could also shape investment flows, especially into high-value segments.
Overall, certain regions in Delhi NCR, such as Noida and Ghaziabad, continue to face very high inventory levels, which may slow near-term growth. Chennai also carries elevated inventory alongside rising new supply, potentially weighing on absorption. In contrast, Bengaluru stands out with the lowest inventory overhang among metro cities, supporting continued growth. Meanwhile, markets like Greater Mumbai, Hyderabad and Pune show a more balanced trend, where elevated inventory is offset by steady sales momentum, while Thane records the highest inventory overhang across metros, posing potential headwinds for growth.
