China is the world’s second-largest economy after the United States in terms of nominal GDP and the largest in real or PPP-adjusted terms. It is undergoing a marked structural shift from its historical reliance on investment and exports towards a greater emphasis on consumption and services.
In this article, we talk about China’s rise as a global economic superpower, its recent economic growth post COVID-19 and also look at the performance of two of its major equity indices: the SSE Composite Index (Shanghai Stock Exchange) and the Hang Seng Index owing to the renewed investor interest in domestically oriented sectors, policy-driven stimulus, the easing of regulatory pressures and increased capital flows owing to AI optimism and recent underperformance.
China’s Economic Rise and Post-COVID Jitters
China’s economic journey over the past seven decades has been one of the most remarkable transformations in modern history. China started from being a largely agrarian, centrally planned, and inward-looking economy in the 1960s. It was marked by significant political upheavals, such as the Great Leap Forward (1958-1962) and the Cultural Revolution (1966-1976), leading to a phase of slowed economic growth. The annual GDP growth during the 1960s and early 1970s averaged around 5%, constrained by low productivity and isolation from the global markets.
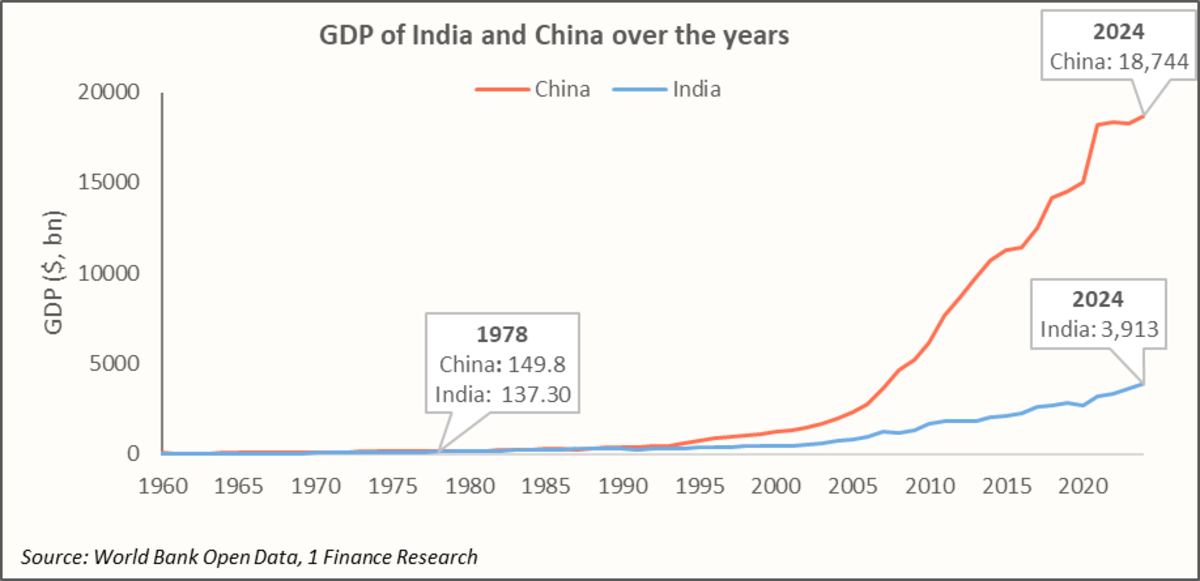
In the 1960s, both China and India had comparable GDP levels, but China’s post-1980s reforms and export-led industrialisation drove rapid growth, while India’s economic expansion and liberalisation reforms came much later in 1991.
A major turning point came in the late 1970s and early 1980s with the economic reforms, referred to as the “Second Great Leap”. These reforms allowed private enterprises and opened China to foreign investment through Special Economic Zones.
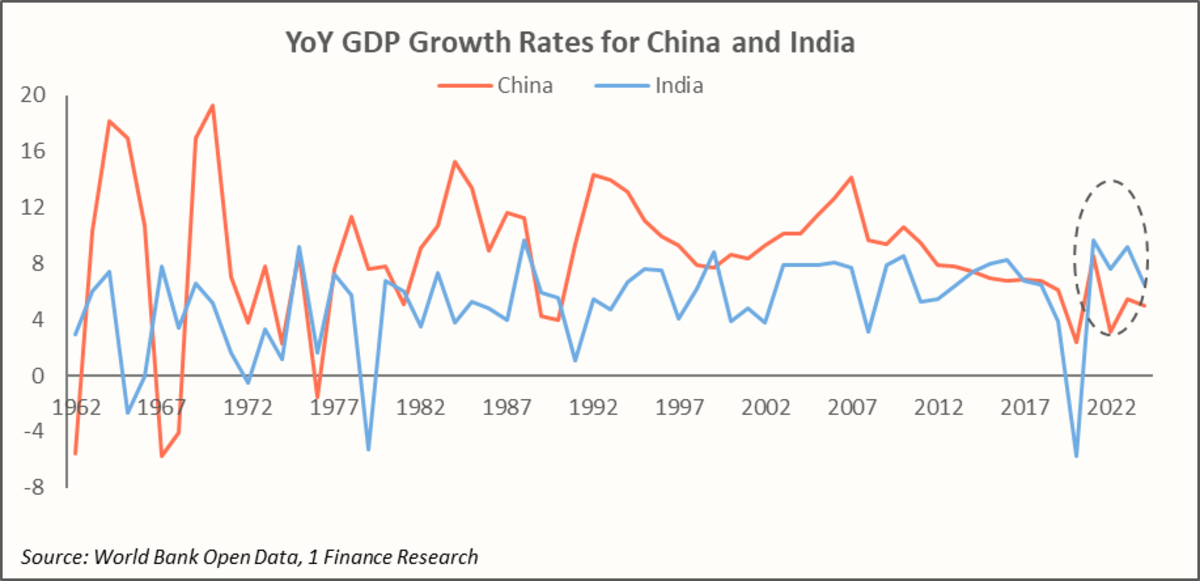
The results were extraordinary: In the 1980s, China’s GDP grew at an average of ~9.3% and in the 1990s at ~10.5%, driven by rapid industrialisation, export-led manufacturing, and large inflows of foreign capital. Millions were lifted out of poverty, and China went on to become the “world’s factory”. China became the world’s second-largest economy in 2010, surpassing Japan, and the largest economy by purchasing power parity (PPP) around 2014-2016.
Post 2015 and especially after COVID-19, China’s growth trajectory has cooled considerably, and it now plans to shift from export-led to consumption-driven growth for long-term sustainability and growing geopolitical and trade-related uncertainties.
In 2024, China’s GDP was driven by Investment (~41%) and Exports (~19%), while Consumption (~40%) had a relatively smaller contribution when compared with other countries such as the United States (69%), United Kingdom (63%), India (61%), and Japan (53%). Sector-wise, agriculture contributed ~7%, industry, ~37%, and services, ~57%. Therefore, China is a service-oriented economy supported by strong investment, domestic demand, and moderate net exports.
In 2024–25, China has pursued an expansionary fiscal policy that emphasises infrastructure investment, targeted household support through subsidies and tax relief, and incentives for strategic sectors like technology and green industries. The People’s Bank of China (PBOC) maintains an accommodative monetary stance through reserve requirement cuts, lower interest rates, and increased sectoral lending, particularly for innovation and green industries. With inflation remaining benign (below 1%), these policies aim to sustain growth and support domestic demand, while stabilising employment.
Next, let’s have a closer look at the two prominent indices in China, the Shanghai Stock Exchange (SSE) and the Hang Seng Index (HSI), and their performance.
Recommended for you
Readers also explored
FMCG Sector in India: Key Trends and Economic Drivers
Nifty 50 Companies List 2025 : Top 50 Stocks in India
Evaluation of the SSE and HSI Indices
The Shanghai Stock Exchange (SSE) is China's largest stock exchange, located in Shanghai. It lists about 1,500 companies but is mostly closed to outside investors, as many shares are restricted A-shares, apart from the unrestricted B-shares. SSE reflects the broader Chinese economy with extensive sector coverage. It mainly represents Chinese state-owned enterprises across sectors like banking, energy, and technology.
The Hang Seng Index (HSI) is a smaller, more focused index of around 50 to 82 of the largest companies listed on the Hong Kong Stock Exchange. It is open to international investors and includes major sectors like finance, communication services, technology, and real estate. HSI serves as a key benchmark for Hong Kong and Chinese-linked stocks.
International investors view Hong Kong as a proxy for Chinese exposure with easier access and better corporate governance, especially as Hang Seng valuations had fallen considerably in 2022 and 2023.
A detailed comparison of the sectoral exposure of the two indices is listed below:
| Sector | SSE Composite | Hang Seng Index |
|---|---|---|
| Financials & Real Estate | 27.4% | 36.8% |
| Industrials | 18.7% | 3.3% |
| Information Technology | 10.8% | 7.2% |
| Materials | 8.2% | 0.9% |
| Energy | 7.5% | 5.1% |
| Consumer Staples | 7.2% | 2.5% |
| Consumer Discretionary | 6.4% | 25.0% |
| Health Care | 5.4% | 1.6% |
| Utilities | 4.8% | 3.1% |
| Communication Services | 3.6% | 14.4% |
The SSE is dominated by state-owned enterprises with limited earnings growth and is mostly closed to foreign investors, limiting capital inflows. On the other hand, the HSI, despite being more accessible internationally, is heavily concentrated in financial and real estate sectors, which have faced regulatory and economic headwinds over the last few years.
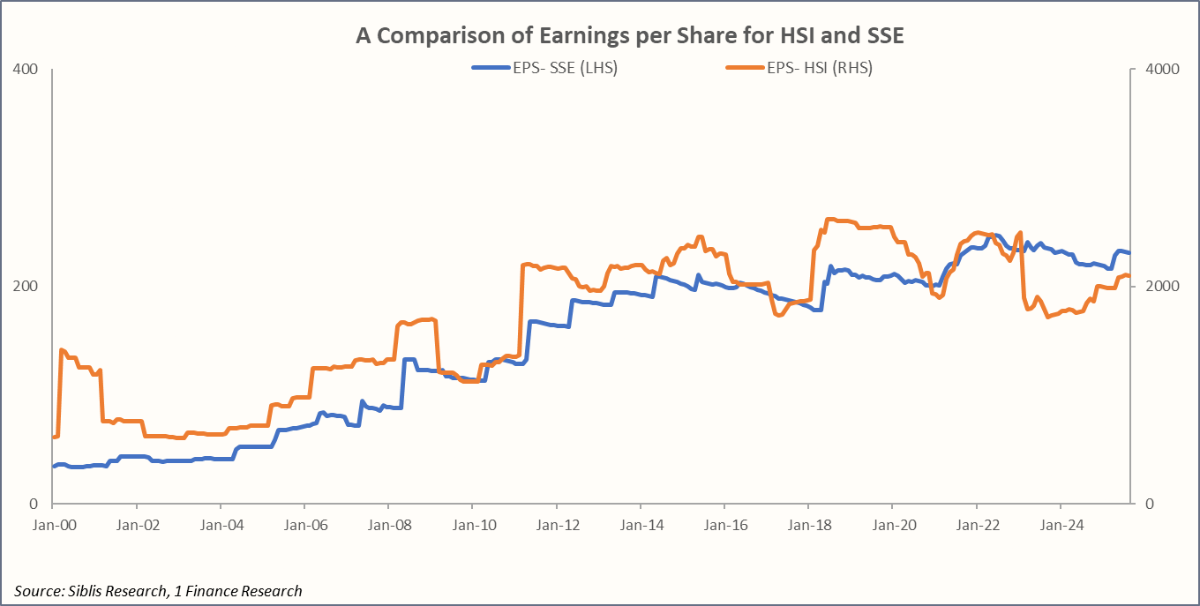
The earnings per share, as shown below, for both indices have grown slowly, affecting the index performance. These factors, coupled with geopolitical and regulatory uncertainties, have constrained long-term index returns despite robust economic fundamentals. The dip in Hang Seng EPS in 2023 was driven by weak Chinese economic data, a property sector crisis, sluggish global demand, and profit declines in key sectors, especially real estate and tech. The recovery later was due to multiple Chinese government stimulus, renewed optimism, and improved prospects in some sectors, resulting in earnings normalisation after extraordinary write-downs and volatile sentiment.
Both the SSE Composite and HSI currently trade near their 25-year median P/E ratios, indicating that their valuations are close to historical averages. However, the HSI has experienced notable P/E expansion over the past 1-2 years, meaning investors have been willing to pay higher prices relative to the earnings. This P/E expansion has helped boost HSI returns recently, despite stagnant earnings growth. The expansion reflects renewed investor optimism fuelled by factors such as expectations of policy support from the Chinese government, easing geopolitical tensions, as well as improving economic indicators in Hong Kong and mainland China sectors.
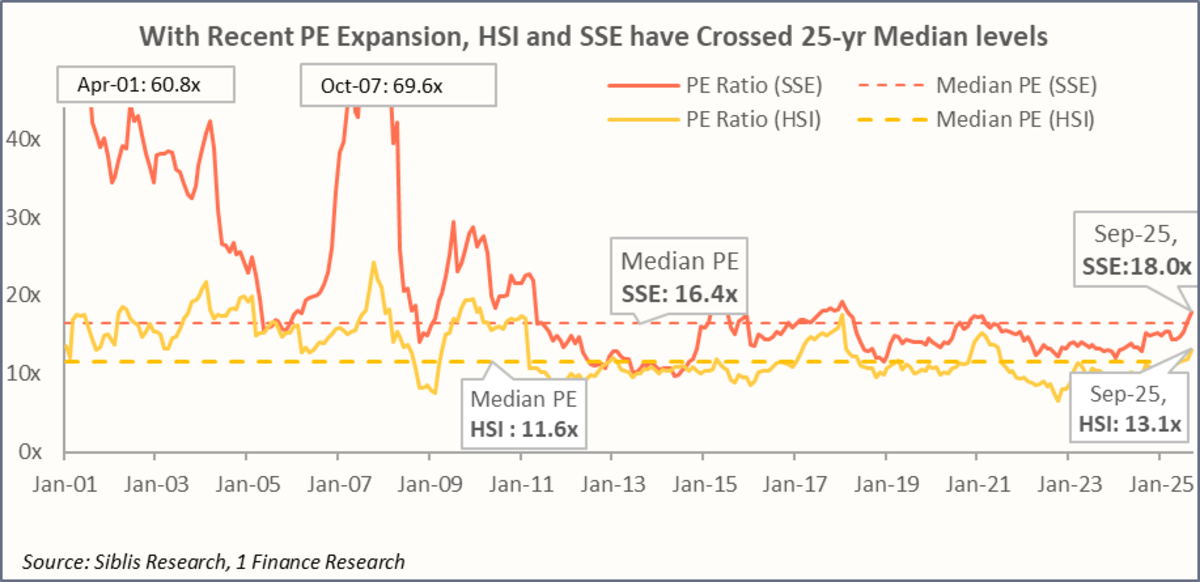
Another reason for the recent interest in HSI also arises because the index offers exposure to major Chinese companies listed in Hong Kong, which are more accessible to international investors compared to mainland markets. Investors see potential value as regulatory pressures moderate and valuations offer room for upside if earnings pick up. The rebound in market sentiment and liquidity inflows into Hong Kong stocks has driven demand and pushed valuations higher.
Comparison of SSE and HSI with Other Global Indices
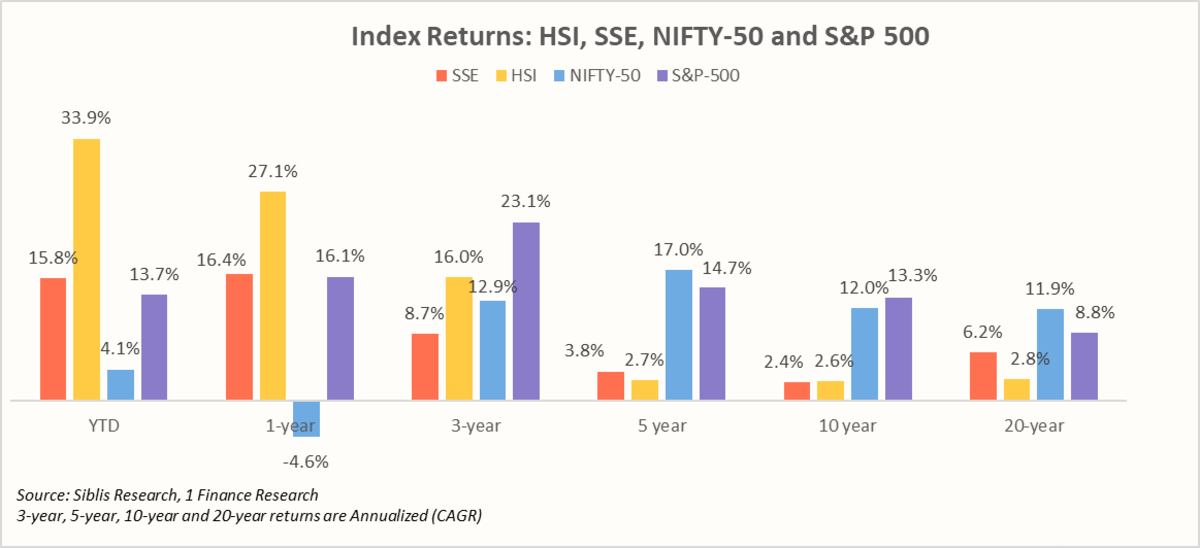
If we compare the returns of these indices with major indices over various time horizons, we see that the annualised returns over 5-year, 10-year, and 20-year periods have been much lower than those of NIFTY-50 and other major global indices such as the S&P 500.
While the HSI offers a dividend yield of around 3.4%, the SSE averages about 2.8%. These yields are lower than those of markets like the UK’s FTSE 100 (3.5%), Singapore (5.0%), and Thailand (4.1%), but remain higher than major indices in the US (S&P 500) and India (NIFTY 50).
Our Global Markets P/E Dashboard shows China’s SSE Composite Index is fairly valued, indicating that its current price is reasonable based on how much the companies earn now and are expected to earn in the future. This suggests investors might find good value in it.
On the other hand, the Hang Seng Index (HSI) is considered highly overvalued, which means the current valuation levels are high compared to earnings. At the same time, the earnings growth has been weak or declining. Put simply, SSE appears to have better chances of earnings growth, while HSI seems expensive without much earnings growth expected. This difference helps explain why the HSI’s higher price reflects caution, given its limited earnings prospects.
For those of you who would like to invest in and build positions in the HSI index, several routes, both direct and indirect, can be considered. We have already covered these options in detail in one of our previous blogs.
Conclusion and Key Takeaways
Let’s summarise all that we have mentioned. Over the long term, both the Hang Seng and SSE indices have generated modest returns and have significantly underperformed indices such as the S&P 500 and NIFTY 50, which have delivered robust double-digit gains in annualised terms. The recent resurgence in Chinese equities is driven by policy support to some of the key sectors and AI-related optimism, but the underlying actual corporate earnings have shown modest gains (EPS actually declined for SSE) over the past year, creating vulnerability if earnings do not catch up in recent months.
The overall market outlook is a mix of various factors: On the positive side, state-led stimulus, AI-driven optimism, easing trade tensions with the US, and PE still hovering around the long-term median. On the other hand, structural challenges persist around corporate governance issues, real estate sector performance, limited foreign participation, and slowing macroeconomic growth weigh down the long-term prospects.
For an investor, Chinese equities represent a tactical allocation and a US diversification alternative rather than a strategic long-term compounder. Despite competitive corporate capabilities and AI-driven growth, structural challenges such as state dominance (in SSE), weak governance, policy uncertainty, and historically poor shareholder returns distinguish them from proven wealth creators like the S&P 500 and NIFTY 50, warranting disciplined position sizing and active risk management.