When we talk about India’s economic growth, a lot of terms get thrown around like GDP, inflation, fiscal deficit, and more. In this blog, we will primarily focus on Private Final Consumption Expenditure (PFCE).
What is Private Final Consumption Expenditure?
Private Final Consumption Expenditure (PFCE) is the total money spent by households (and non-profit institutions serving households) on goods and services for consumption. In simple terms, every time you buy groceries, pay your child’s school fees, book a holiday, or even renew your Netflix subscription, you’re contributing to PFCE.
What’s the Difference Between PFCE vs. Consumer Spending
You might be wondering: isn’t this just another way of saying “consumer spending”? Well, kind of.
When we casually talk about consumer spending, we usually mean what households spend on their day-to-day needs, lifestyle, or luxury choices. It’s more of an everyday concept. PFCE, on the other hand, is a formal economic measure used in calculating GDP. It’s broader, structured, and standardised so that economists and policymakers can track it consistently over time.
Think of it this way: “consumer spending” is the everyday phrase, while PFCE is the official entry in the national accounts.
How PFCE Fits into GDP
GDP, when calculated through the expenditure method, has four main components:
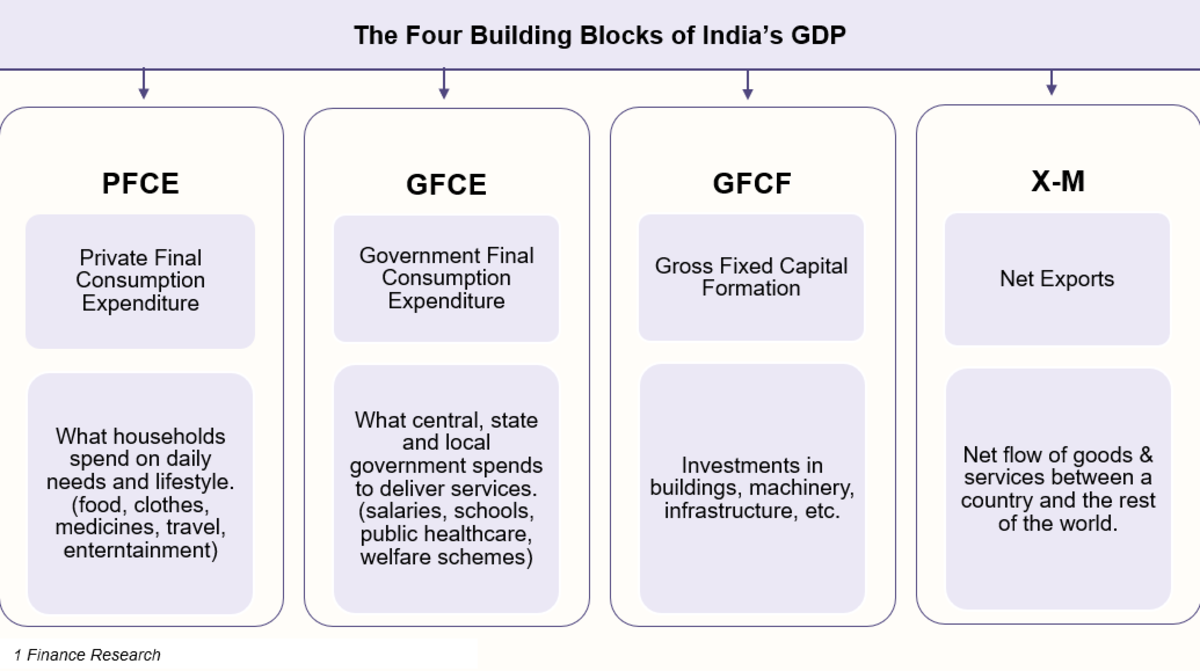
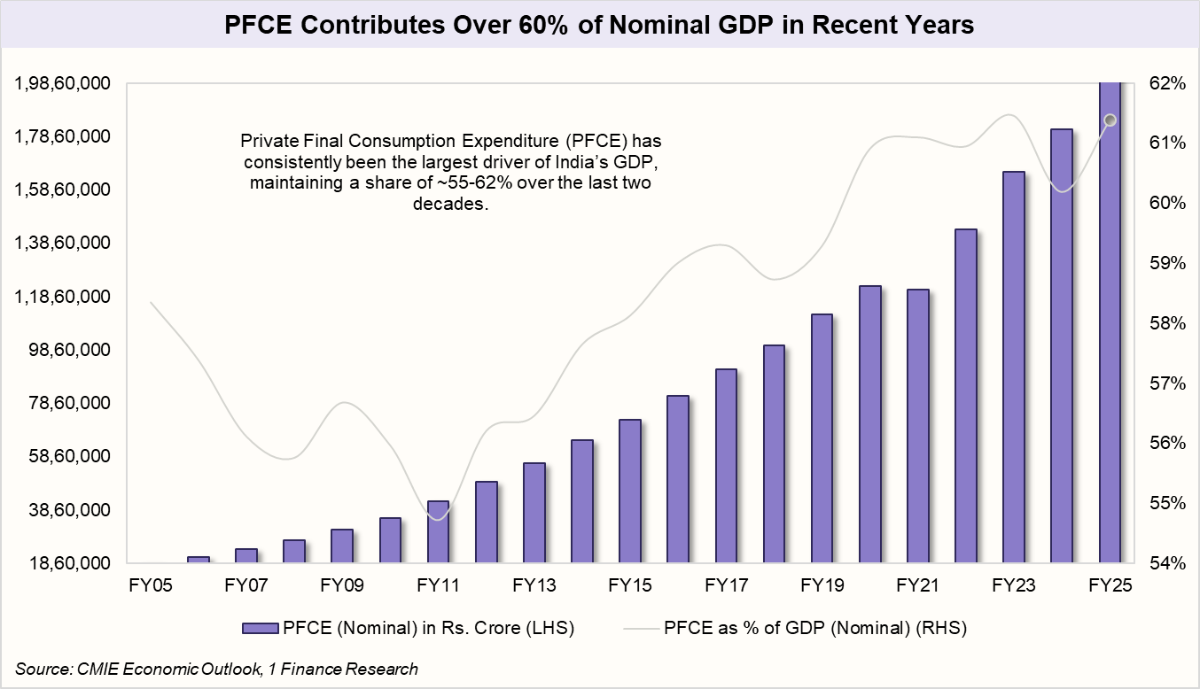
Among these, Private Final Consumption Expenditure (PFCE) stands out as the largest contributor to India’s GDP.
Why PFCE Matters for India
In FY25, PFCE climbed to 61.4% of GDP, the second highest in the last two decades. That means more than half of India’s GDP is powered by what its citizens are spending.
This is crucial because it highlights the nature of India’s growth story. Unlike some economies that are heavily dependent on exports, India’s growth is fueled from within, by its people. A growing middle class, rising disposable incomes, and expanding aspirations make consumption the engine of India’s economy.
When PFCE is strong, it signals rising confidence among households, healthier demand across sectors, and overall economic vibrancy. On the flip side, if PFCE weakens, it could be a red flag for slowing demand and growth.
Recommended for you
Readers also explored
How Tax Relief and Rate Cuts Will Shape India’s Economy
Nifty 50 Companies List 2025 : Top 50 Stocks in India
How is PFCE calculated?
PFCE in India is estimated by MOSPI using the commodity-flow method. It’s published in both nominal (current prices) and real (inflation-adjusted) terms. Data comes out quarterly with GDP releases and annually in the National Accounts Statistics.
India’s Consumption Reaction to Crises and Recoveries
Did you know that consumption isn’t always steady; it can swing sharply depending on the economic environment?
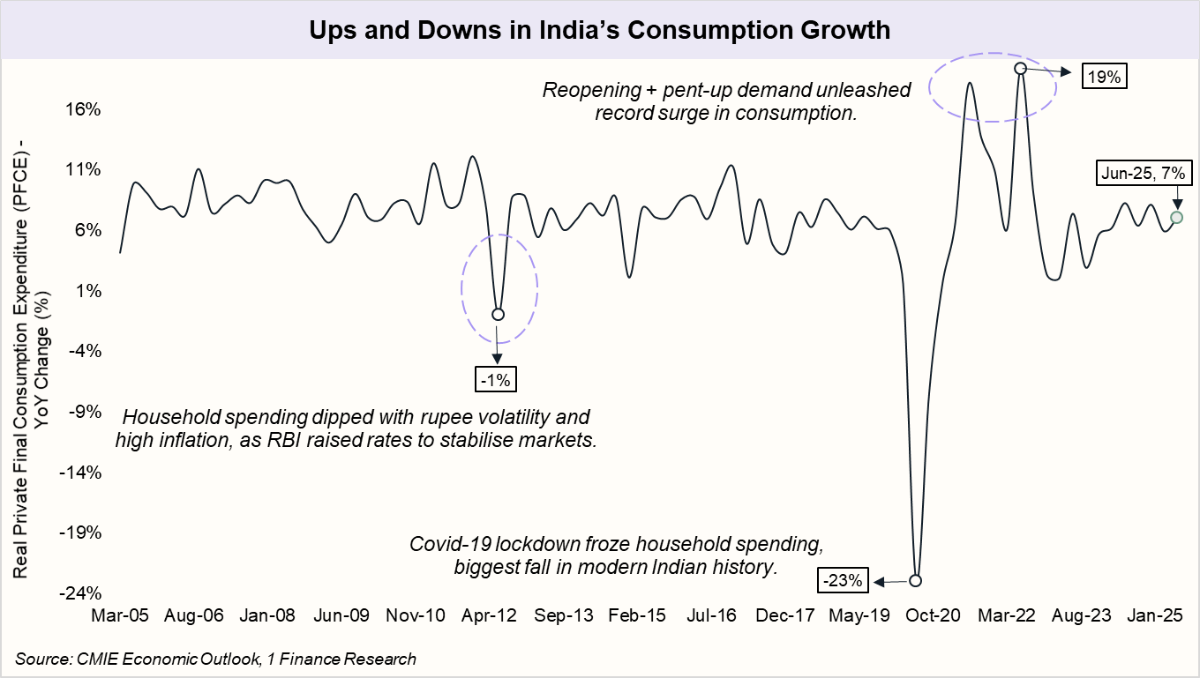
Take India, for example. During the lockdowns, household spending (PFCE) collapsed by over 20% year-on-year, a historic fall. But soon after, pent-up demand and a low base effect fueled a dramatic rebound, pushing spending well above trend.
Fast forward to Q1 FY26: PFCE rose 7% YoY, easing from 8.3% a year ago. The dip comes mainly from a slowdown in urban spending, even as rural demand stays strong, outpacing cities for the sixth straight quarter. To counter this, the government rolled out income-tax relief, a 100 bps repo rate cut, and implemented GST slab rationalisation. The goal is clear: put more money in people’s hands, ease borrowing costs, and reignite both urban and rural consumption just as city demand shows fatigue.
The chart below walks you through these shifts, showing how consumption has moved across key economic events.
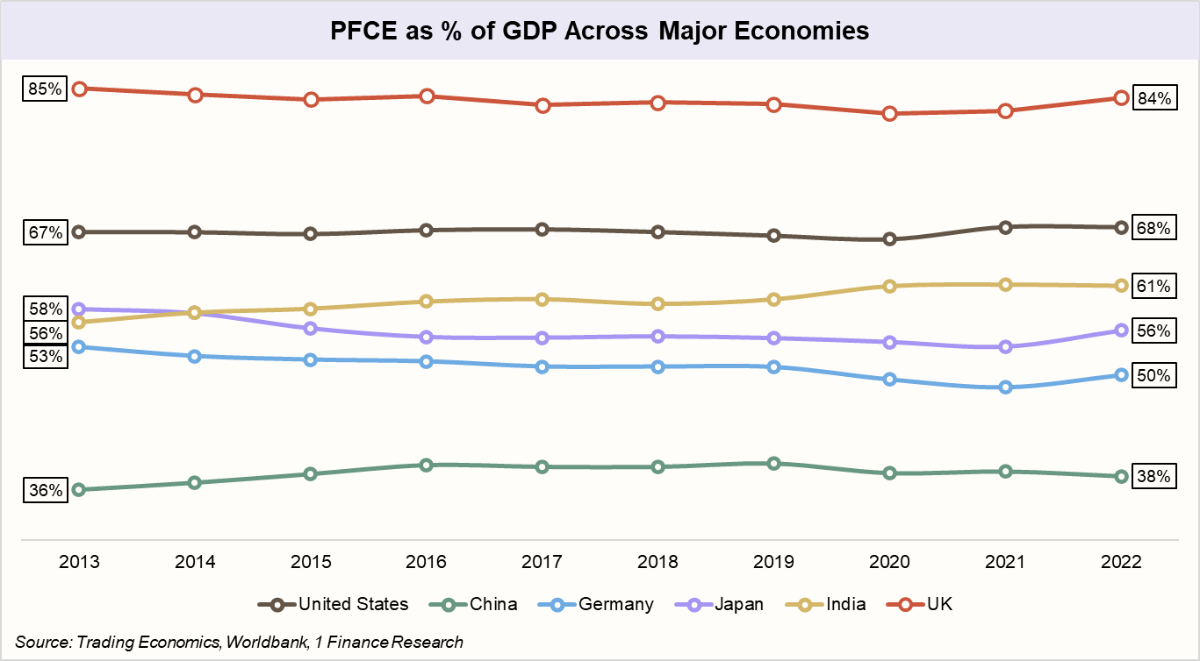
How Much Do Households Drive Growth? A Global Comparison
We already know India's economy leans heavily on household consumption. But what about other countries? Well, the role of household spending varies significantly. The US and UK are consumption-driven economies, while Germany and Japan rely more heavily on exports. China, on the other hand, has historically been driven by investment. This makes India’s growth model distinctly consumption-led.
How Indian Spending Habits Are Shifting
In India, earlier, food was the biggest chunk of spending, close to 31% of household budgets. Now, that's down to 26%, showing a major shift. Indians are spending less on basics and more on mobility, lifestyle, and services. For example, spending on transport has jumped from 14% to 19%. This is a classic sign of an evolving economy, where a growing middle class has more disposable income for things beyond just essentials.
This shift is also reflected in discretionary spending. While categories like restaurants and hotels make up just 3% of the total, their spending patterns are incredibly volatile. For instance, spending in this category plunged by 52% during the 2021 lockdowns and then surged by 69% in 2023. This highlights how non-essential spending can swing dramatically based on social and economic factors, unlike stable essentials like food.
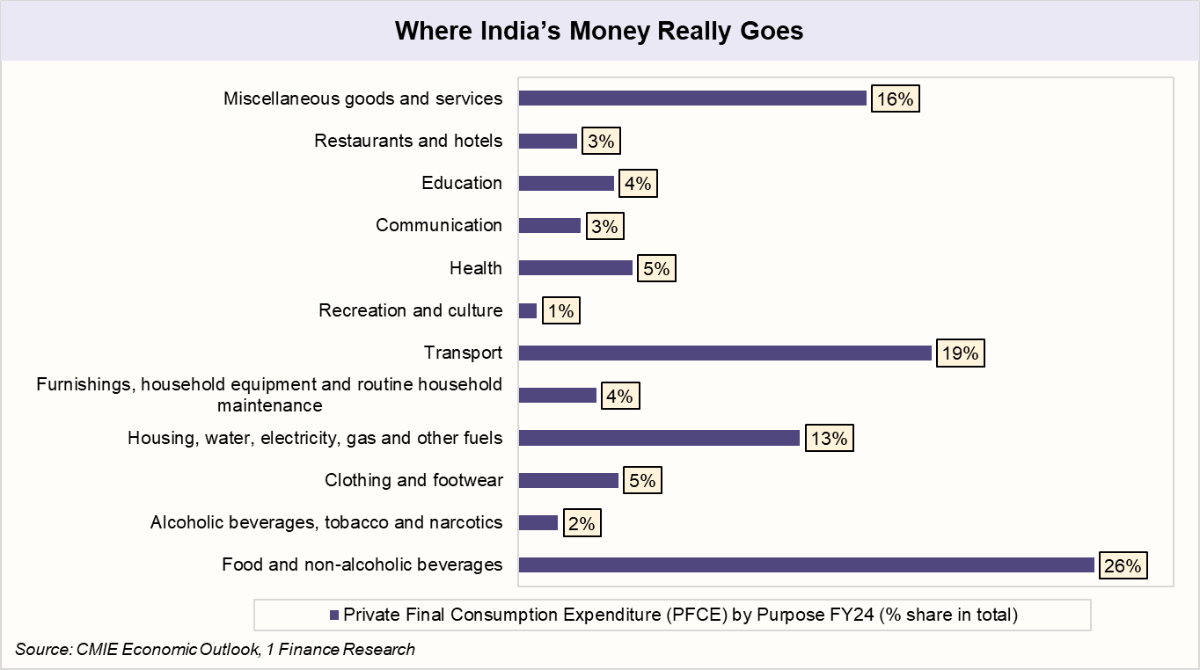
The message is clear. India is gradually spending less on basics and more on mobility, lifestyle, and services. The long-term trend is slow, but the short-term cycles can be intense. This shift will shape how businesses and investors capture the next wave of consumption.
| Trends in India’s Private Final Consumption Expenditure (PFCE) - (FY14 to FY24) | |||
|---|---|---|---|
| Category | FY24 % share in total | FY24 YoY % Change | Trend |
| Food and non-alcoholic beverages | 31% | 26% | Declining |
| Alcoholic beverages, tobacco and narcotics | 2% | 2% | Flat |
| Clothing and footwear | 7% | 5% | Declining |
| Housing, water, electricity, gas and other fuels | 16% | 13% | Declining |
| Furnishings, household equipment & maintenance | 3% | 4% | Mild Growth |
| Transport | 14% | 19% | Growing |
| Recreation and culture | 1% | 1% | Flat |
| Health | 4% | 5% | Growing |
| Communication | 2% | 3% | Growing |
| Education | 4% | 4% | Growing |
| Restaurants and hotels | 2% | 3% | Growing |
| Miscellaneous goods and services | 14% | 16% | Growing |
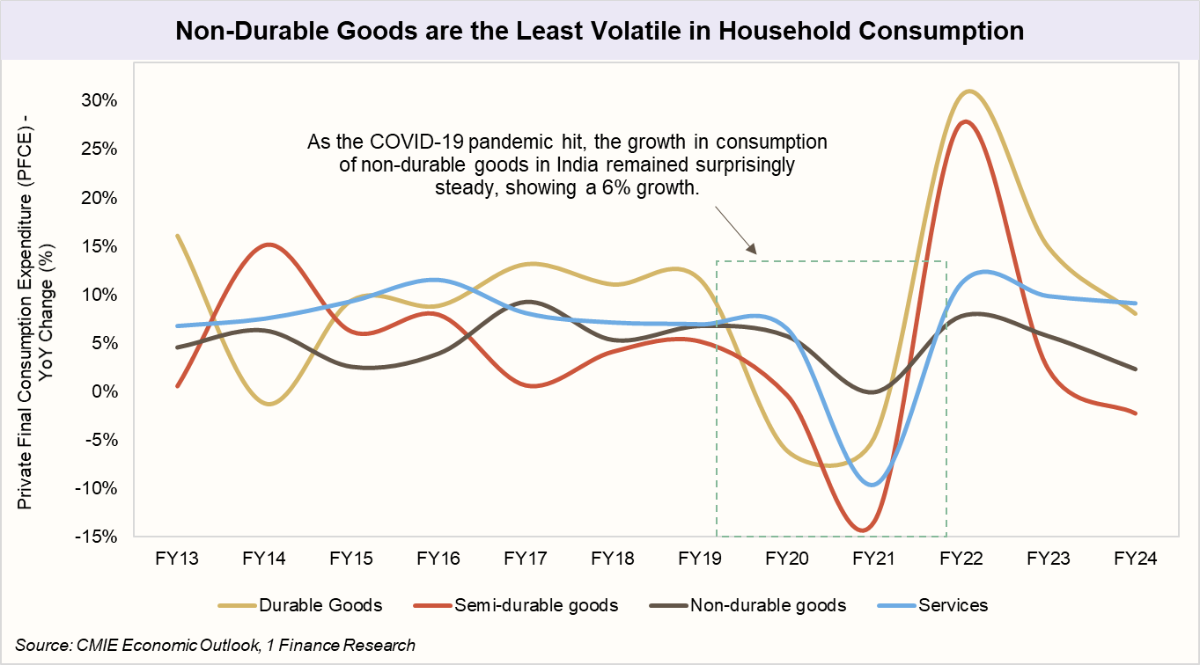
From Must-Haves to Nice-to-Haves
In times of crisis, spending shifts. The pandemic saw Indians prioritise essentials, with non-durable goods consumption growing at 6%. In contrast, anxiety caused a sharp drop in durable goods, which saw a negative 6% growth. This reflects a fundamental consumer preference: to buy what’s necessary and postpone what’s not.
How Consumption Shapes Every Asset Class
Every time you swipe your card, take a home loan, or even cut back on groceries, you’re quietly moving the economy. Which means the rise or fall of PFCE doesn’t just affect your wallet; it ripples across equities, debt, real estate, gold, and even crypto. Here’s a quick snapshot of how it plays out:
| Characteristic | When PFCE is HIGH (↑) | When PFCE is LOW (↓) |
|---|---|---|
| Loans & Credit Cards | Higher demand for home, auto & durable loans; banks lend aggressively; credit card usage expands into lifestyle spending. | Households delay big purchases; loans slow; credit cards are used mainly for essentials; lenders tighten criteria. |
| Equities | Bullish for FMCG, retail, autos, durables: valuations rise as investors chase consumption-led growth. | Drag on consumption-driven sectors; investors shift to defensive sectors (utilities, healthcare) or debt. |
| Debt | Rising consumption may trigger inflation → RBI raises rates; bond prices fall. | Weak consumption may lead RBI to cut rates; bond prices rise; borrowing costs fall for government & corporates. |
| Real Estate & REITs/InvITs | Higher demand for homes & retail/office spaces; REITs benefit from stronger rentals & valuations. | Home purchases postponed; property prices stagnate; REITs face lower occupancy & rental income. |
| Gold & Commodities | Disposable incomes boost jewellery demand; commodities stay strong with higher industrial activity. | Gold attracts safe-haven demand; commodities may weaken as industrial demand slows. |
| Crypto | Higher risk appetite & disposable income drive inflows into speculative assets like crypto. | Investors turn risk-averse, pulling money out of crypto into safer assets. |
| Personal Finance | Risk of lifestyle inflation; need for budgeting to balance spending with savings. | Households cut discretionary expenses; focus shifts to savings, emergency funds, and debt reduction. |
So, PFCE isn't just a number; it's the real engine of India's growth. It's powered by you, by me, by every purchase we make. This spending reflects our confidence and fuels everything from businesses to markets. Keeping an eye on it is key to understanding where the economy is headed.