An in-depth look at what defines India’s auto industry, how it’s performing, and where it’s headed in FY2026.
The Indian automobile sector is facing multiple roadblocks this year, and for good reasons. A slowing global economy and rising geopolitical tensions have already made uncertainty the dominant theme for 2026.
Combine that with:
- Decline in domestic manufacturing,
- Volatile oil prices, and
- Disruption in the supply of key raw materials-
The industry is bound to face pressure.
During times like these, investors must revisit their portfolios and rebalance sectoral exposures. We’re here to help you with just that. With this blog series, we aim to break down the principal macroeconomic forces driving India's key sectors and arrive at their outlooks for the coming years.
This time, we take a look at India’s Automobile Sector.
How significant is the automobile sector to the county’s economy?
As the fourth largest in the world, the sector contributes significantly to the economy, contributing-
- 7.1% of India's GDP
- 49% of manufacturing GVA
- 35 million+ jobs (direct and indirect)
From a macroeconomic perspective, the automobile sector is a key indicator of broader economic trends, namely:
- Urban demand - Reflected through PV (Passenger Vehicle) and 2W (Two-Wheeler) sales
- Rural sentiment - Influences tractor and entry-level 2W sales
- Manufacturing output and export competitiveness can be seen by auto components
Naturally, the automobile sector’s size and influence make the sector’s performance a key factor in India’s overall economic health.
How did the automobile industry perform in the past year?
- Vehicle Manufacturing Segment:
| Category | Key Observations | Total Vehicle Sales Growth YoY | Market Share (Units sold in FY2025) | Expected Sales Growth FY2026 | |
|---|---|---|---|---|---|
| FY2024 | FY2025 | ||||
| Passenger Vehicles | 1- High base effect in FY 2024 (4.2 million units) resulted in a moderate 2% growth in domestic sales. 2- FY2025 is expected to see recovery on the back of steady growth in the SUV segment due to new launches and soft interest rates | 7.4% | 3.7% | 15.9% | 1-4% |
| Commercial Vehicles | 1- Weak performance in FY2025 was mainly due to a slowdown in freight movement during the general elections 2- Recovery of construction activity and sustained rural demand will support the revival of CVs | -0.6% | 0.3% | 3.2% | 3-5% |
| Two Wheelers | 1- Healthy growth in FY2025 was driven by strong rural demand and a notable 21% rise in exports. 2- Continued rural strength, easing inflation, and supportive interest rates will sustain growth momentum | 9.8% | 11.1% | 74.5% | 6-9% |
| Tractors | 1- Tractor segment recovered modestly in FY2025 with 6% growth after facing a significant rural slowdown in FY 2024 due to uneven monsoon 2- FY2026 outlook remains positive, driven by above-normal monsoon, higher minimum support prices (MSPs), and revival in construction demand | -11.6% | 6.4% | 3.2% | 4-7% |
| (Total Vehicle Sales include domestic sales and exports) | |||||
Recommended for you
Readers also explored

Is India’s Housing Market Still a Good Bet?

Currency in Circulation: How Much Money Exists in the World?
- Auto-Component Manufacturing Segment:
ICRA has revised its FY2026 revenue growth outlook for the Indian auto component industry to 6–8%, slightly lower than the earlier estimate of 8–10%, mainly due to concerns around US tariff hikes. The new duties could add an estimated ₹9,000 crore in costs across the supply chain. If Indian exporters end up absorbing 30–50% of that burden, operating margins could shrink by 50–100 basis points—and even more for export-focused companies, where the hit could be as high as 150–250 bps.
Now, while the US makes up only about 8% of the industry's total revenues, exports to that market have grown at a healthy 15% CAGR between FY2020 and FY2024. So the exposure is relatively contained, but not insignificant. The good news is that over 70% of the industry's revenues still come from domestic demand, providing a strong anchor and helping keep the broader outlook steady, despite global headwinds.
With that context on sub-sectors, let’s see how some of India’s leading automobile companies performed in FY2025:
| Sr. No. | Company | Sales Y-o-Y | Operating Profit Margin | Net Profit Margin | Sales CAGR 5Yr | P/E |
|---|---|---|---|---|---|---|
| 1 | Maruti Suzuki India | 8% | 13% | 9% | 15% | 27.69 |
| 2 | Mahindra & Mahindra | 14% | 19% | 9% | 16% | 30.94 |
| 3 | Tata Motors | 1% | 13% | 6% | 11% | 8.8 |
| 4 | Bajaj Auto | 14% | 19% | 14% | 11% | 31.97 |
| 5 | Eicher Motors | 14% | 25% | 25% | 16% | 32.29 |
| 6 | TVS Motor Company | 13% | 15% | 5% | 19% | 62.73 |
| 7 | Samvardhana Motherson International | 15% | 9% | 4% | 13% | 28.38 |
| 8 | Bosch | 8% | 13% | 11% | 13% | 46.61 |
| 9 | Hero MotoCorp | 8% | 14% | 11% | 7% | 19.66 |
| 10 | Ashok Leyland | 6% | 19% | 7% | 17% | 23.18 |
| 11 | Bharat Forge | -4% | 18% | 6% | 13% | 60.52 |
| 12 | MRF | 12% | 15% | 7% | 12% | 31.58 |
| 13 | Tube Investments of India | 15% | 10% | 5% | 33% | 81.26 |
| 14 | Balkrishna Industries | 12% | 24% | 16% | 17% | 28.07 |
| 15 | Exide Industries | 3% | 10% | 5% | 4% | 41.28 |
What drove the numbers?
- Sales Growth: Exports Lead the Pack:
- Sales growth across the sector is modest, ranging from high single digits to mid-teens, suggesting overall healthy demand, but with wide variation.
- Export-focused automotive manufacturing companies like Motherson, Tube Investments, and Balkrishna Industries posted the strongest year-on-year sales growth. That’s a clear sign of robust export demand over the past year.
Even within the core vehicle‐manufacturing segment, export volumes have outpaced the domestic market, growing at a 4.1% CAGR versus 2.7% for domestic sales:
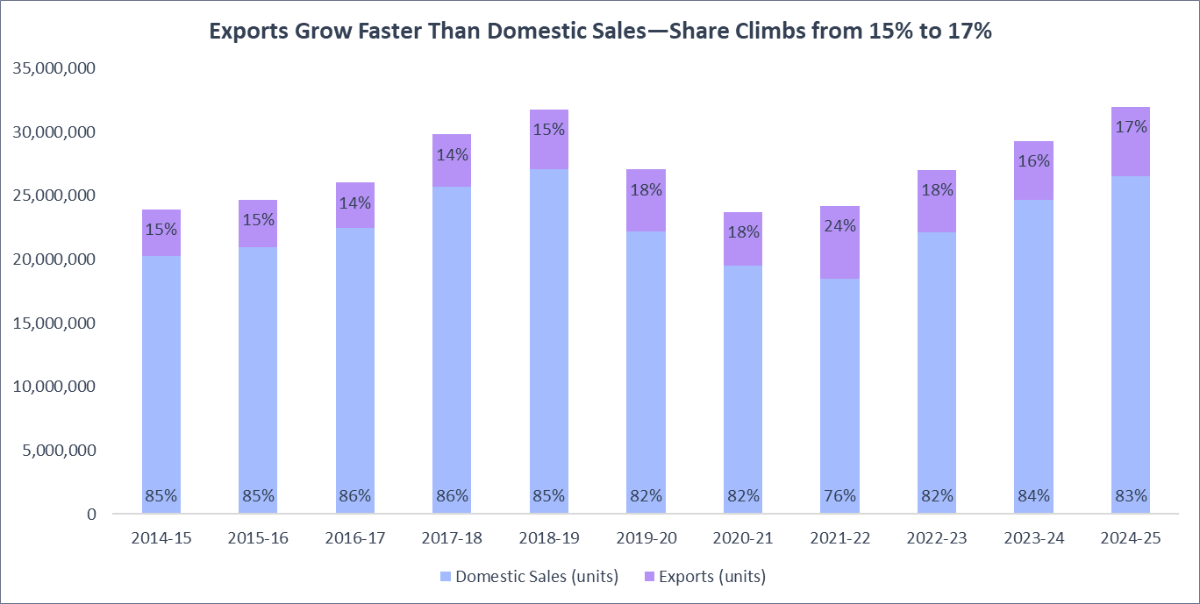
Source: CMIE Economic Outlook, 1 Finance Research - On the other hand, companies more focused on domestic sales, such as Tata Motors, Hero Motocorp, and Ashok Leyland, showed slower, more moderate growth, pointing to a more subdued domestic demand environment.
- Profit Margins: Exports and Premium Products Shine
- Profit margin trends paint a clear picture - exporters and premium product makers like Eicher Motors and Balkrishna Industries enjoy the highest operating and net profit margins.
- This suggests that both export markets and premium segments offer not only better growth but also stronger profitability.
- Domestic-focused companies remain profitable but tend to rely more on volume than margin to drive earnings.
The Takeaway: In FY2025, the Indian automobile sector posted steady growth, driven by strong export demand and premium segments, while domestic sales showed a more cautious pace.
What will drive the road ahead, though?
Here are some key macroeconomic factors to look out for in the coming years that will determine the automobile sector’s performance:
| Macro Factor | Outlook | |
|---|---|---|
| 🟡 | Index of Industrial Production (IIP) Auto | While year-on-year growth in overall manufacturing slowed from 5.77% in Jan to 2.59% in May 2025, the auto sub-index rose from 5.55% to 6.25%, even touching 15% in April. So, even as the broader manufacturing sector cools, autos are holding steady, though some drag from the wider slowdown may still play out. |
| 🟢 | Rural Demand | Rural consumption has been rising, driven by favorable monsoon conditions, easing inflation, and strong agricultural output. According to RBI, private spending grew 7.1% in Q4 FY2025, with much of this growth attributed to rural areas. This is reflected in the domestic sales of two-wheelers and tractors—key indicators of rural economic activity—which grew by 11% and 6% respectively in FY2025. |
| 🟢 | Steel Prices | Steel prices have been dropping since March 2024 and recorded a 1.29% decline year-on-year in May 2025. This mainly comes from global oversupply, driven by a surge in Chinese exports and softer demand in India’s infrastructure and construction sectors. For the auto industry, this is good news — lower steel prices mean reduced costs, which boosts margins, especially for two-wheelers and entry-level cars. It also supports higher production, thanks to cost savings and growing demand. |
| 🟢 | Interest Rates | Between May 2022 and Jan 2025, the RBI raised interest rates by 250 bps, and vehicle loan rates rose almost proportionately—by around 205 bps—indicating a strong transmission. Now, in the ongoing easing cycle, since the first 25 bps rate cut in February 2025, vehicle loan rates have come down by only 8 bps. With another 75 bps cut announced till June 2025, lending rates are expected to ease further—bringing down auto loan costs and supporting vehicle demand in the coming quarters. |
| 🟡 | Oil Prices | With U.S. oil production rising, OPEC+ has been boosting its supply to regain pricing power. They plan to add 411,000 barrels per day and have already started ramping up since April 2025. If tensions in the Middle East stay calm, this extra supply should keep oil prices low through 2026, which will help the auto sector by lowering both raw material costs and fuel expenses for consumers. |
While India’s domestic economy seems to support growth, the automobile sector’s strong export performance—growing 19% compared to 7% growth in domestic sales in FY2025—makes it sensitive to external factors like geopolitical tensions and trade wars. Here are the key global factors that might impact India’s automobile sector in FY2026:
- Tariffs and Trade Barriers:
The US has steadily become a more important market for India’s auto exports—its share rose from 26% to 32% between FY2015 and FY2025, growing at 8% CAGR, compared to 5% for overall exports. While this highlights the sector’s increasing exposure to the US tariffs, there’s some relief for now: SIAM has clarified that the recent 27% US tariffs on select Indian goods do not include automobiles, so the immediate impact is expected to be minimal.
However, trade negotiations between India and the US have been slow, and that adds a layer of uncertainty about potential future tariff actions that could impact the sector. - Raw Material Supply Disruptions
Rare earth metals like neodymium and dysprosium are critical components in the motors used to power Electric Vehicles (EVs). The challenge? China controls nearly 90% of the global supply and has recently tightened export restrictions. This poses a significant risk for India, which imports over 90% of its rare earth needs from China. In fact, Maruti Suzuki has already scaled back its EV production targets due to these supply constraints.
But let’s not panic—EVs, while growing fast (15.7% YoY in FY2025), only made up 7.8% of India’s total auto sales. So, while the segment is expanding, it’s still a small part of the overall market.
Plus, the government has already stepped in, proposing a ₹3,500–5,000 crore, seven-year plan to boost domestic rare earth production and reduce import dependence.
In short, the disruption is real—but short-term—and efforts are already underway to build long-term resilience as EV adoption gains momentum.
What to Expect in 2026?
In many ways, the automobile sector mirrors the broader trajectory of India’s economic development. It reflects both rural and urban demand, contributes significantly to manufacturing output, and plays a growing role in India’s export basket.
This close relationship is evident in the strong 75% correlation between auto sales and GDP growth over the years. It’s clear: when the economy grows, the auto sector tends to accelerate alongside it.
The graph below clearly illustrates this pattern, with both indicators rising and falling in tandem across economic cycles.
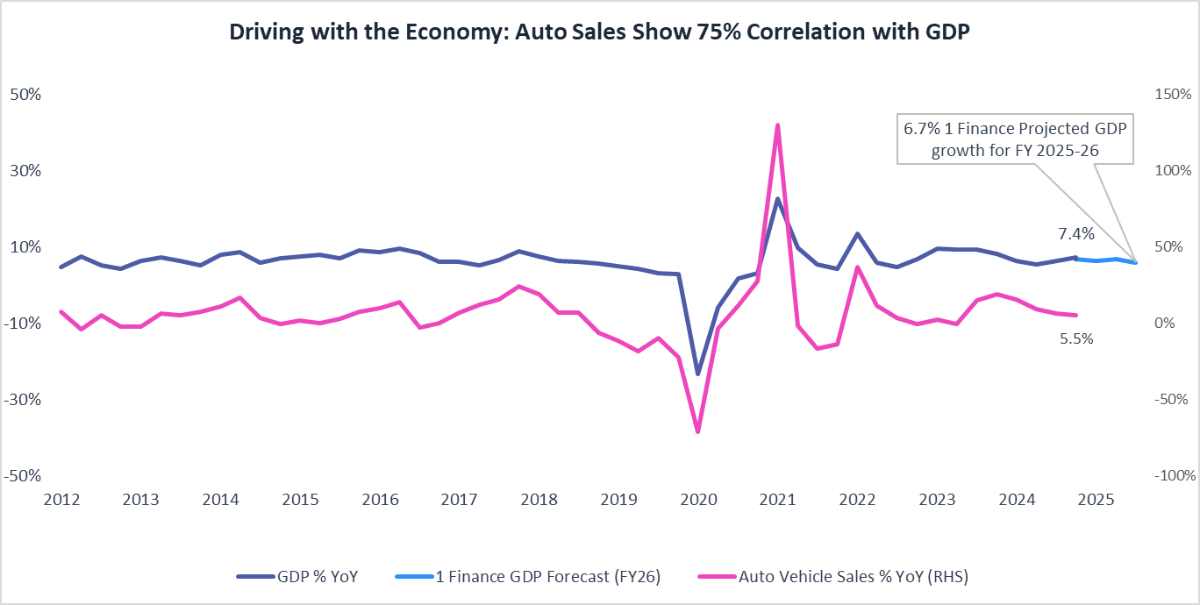
At 1 Finance, we project India’s GDP to grow by 6.7% in FY 2025–26, suggesting a modest but steady economic expansion in the coming quarters. If past trends hold, we can reasonably expect automobile sales to follow a similar growth trajectory, reinforcing the sector’s importance as both a driver and indicator of India’s economic development.