
Qa Update by IMI
We got 91% of 2025 right. That sounds high, but the 9% we missed taught us quite a lot. In this edition, we look back at our 2025 macroeconomic outlook and ask: how did our forecasts hold up against reality?
At the start of 2025, we made several bold predictions. We will walk through each major theme and asset class, sharing what worked, what didn’t, and why it matters for the year ahead.
The table below offers a snapshot of what worked and what didn’t, before we dive into detail:
| Category | Our 2025 Outlook | Actual 2025 Outcome | Verdict |
|---|---|---|---|
Indian Equities | We expected Indian Large Cap Equities to outperform the Mid and Small Cap Equities. | Large Cap: +10% Mid Cap: +5% Small Cap: -8% | ✓ Accurate |
Gold | We were positive on Gold, anticipating continued price appreciation. | XAU/USD: +74% | ✓ Accurate |
Rupee | We expected the rupee’s depreciation to continue in the near term. | Rupee ↓
5% against Dollar 12% against Pound Sterling 19% against Euro 5% against Japanese Yen | ✓ Accurate |
U.S. Equities | We were neutral on U.S. Equities due to valuation and fiscal risks. | AI-led earnings surprised on the upside.
S&P 500: +15% Nasdaq 100: +19% | 🚨Partially Accurate |
| Chinese Equities | We were positive on Chinese Equities due to policy support and attractive valuations. | SSE Composite Index: +26% HSI Index: 34% | ✓ Accurate |
| Indian Debt | We expected India’s short-term bonds to lead the rate cut rally. | Ultra Short-Term Bonds: +7%
| ✓ Accurate |
| India Residential Real Estate | We were positive on India’s Residential Real Estate, led by peripheral metro growth and improved affordability due to expected rate cuts. | 1 Finance Housing Total Return Index:
| ✓ Accurate |
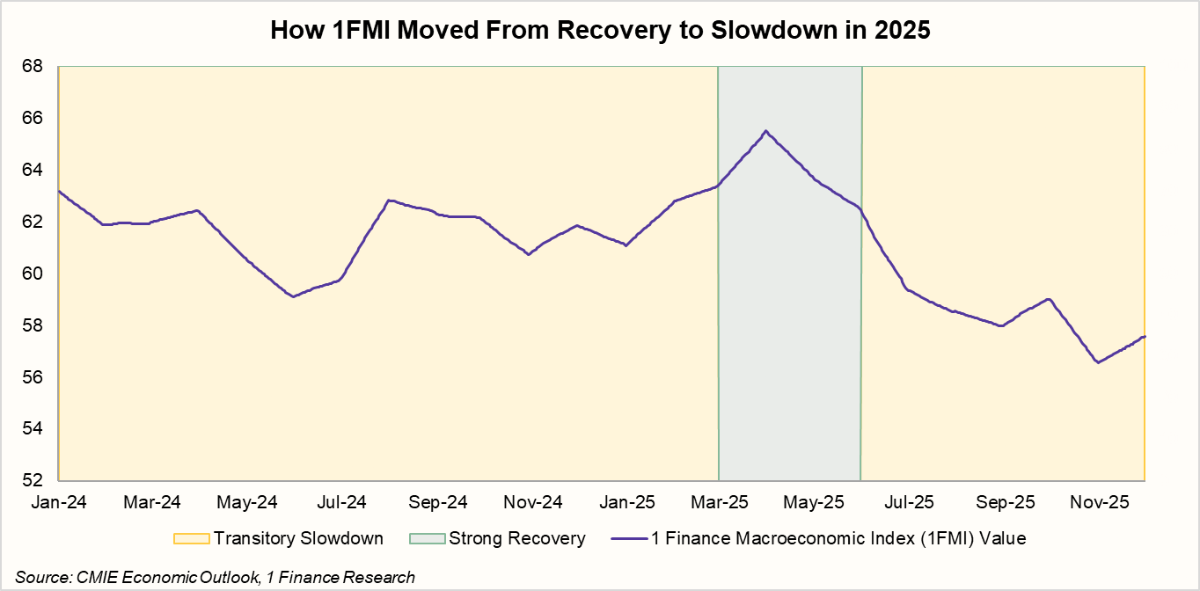
| Macroeconomic Phase | We assigned a 60% probability of India entering a Strong Recovery phase, and a 25% probability of a continued Transitory Slowdown. | India briefly entered a Strong Recovery Phase in early 2025, but global shocks and private capex hesitation pulled the economy back into Transitory Slowdown. 1 Finance Macroeconomic Index: ↓ 6% | 🚨Partially Accurate |
| Public Capex and Rural Demand | We expected public capex and rural consumption to be the key growth anchors in 2025. | Front-loaded government capex (55% of BE by October 2025 vs. 46% in the same period last year) led to a slight pick-up in industrial activity.
| ✓ Accurate |
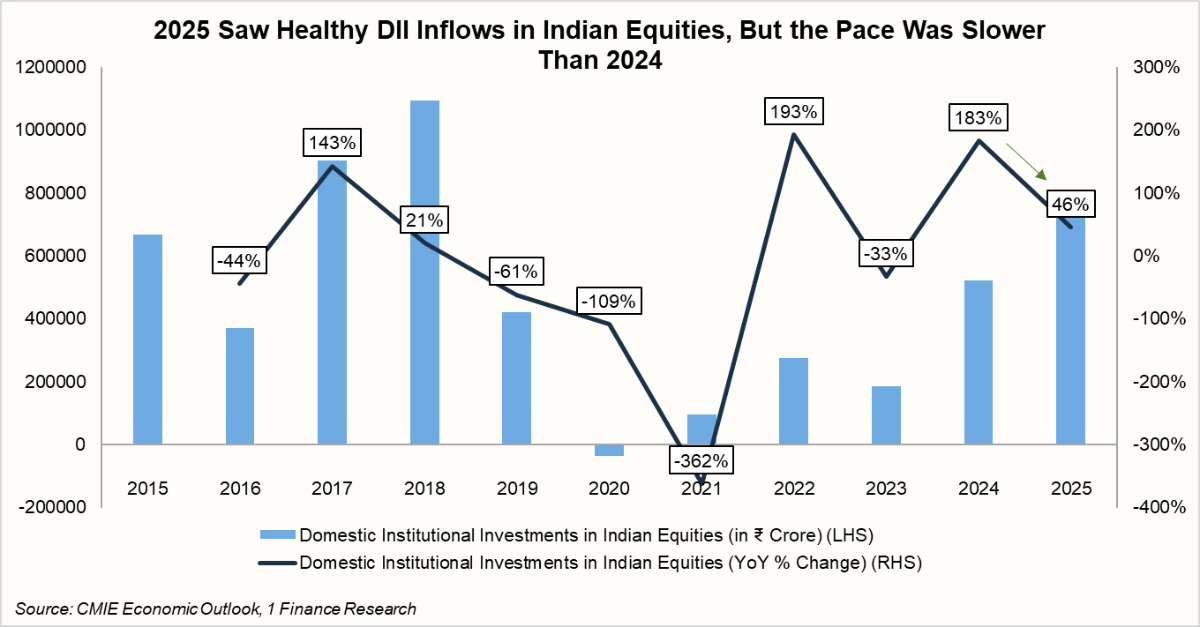
| Domestic Institutional Investments (DII) in Indian Equities | We expected DII inflows to moderate compared to the high YoY growth seen in 2024. | DII participation remained strong in absolute terms in 2025. But YoY growth moderated to 46% from 183% in 2024, just as we expected. | ✓ Accurate |
| Manufacturing and Services Sector Performance | We expected services sector growth to offset marginal manufacturing sluggishness in 2025. | Manufacturing showed a modest recovery, while the services sector outperformed, with an increasing share of GDP (56.2% vs. 55.7% in 2024, up to Q3). | ✓ Accurate |
Source: CMIE Economic Outlook, Investing.com, Value Research, 1 Finance Research
Recommended for you
Readers also explored

Macro Outlook 2025
India’s Unemployment Rate in 2025
The Public Capex and Rural Demand Thesis Played Out Well
In our 2025 outlook, we said cooling inflation, strong public capex, and increased rural demand would signal a pivot to sustainable growth. Our projection was right. Public capex frontloading reached 55% of the Budget Estimates by October 2025, supporting industrial activity.
Rural inflation fell much more than urban inflation this year. This boosted rural FMCG and vehicle sales, outpacing urban growth.
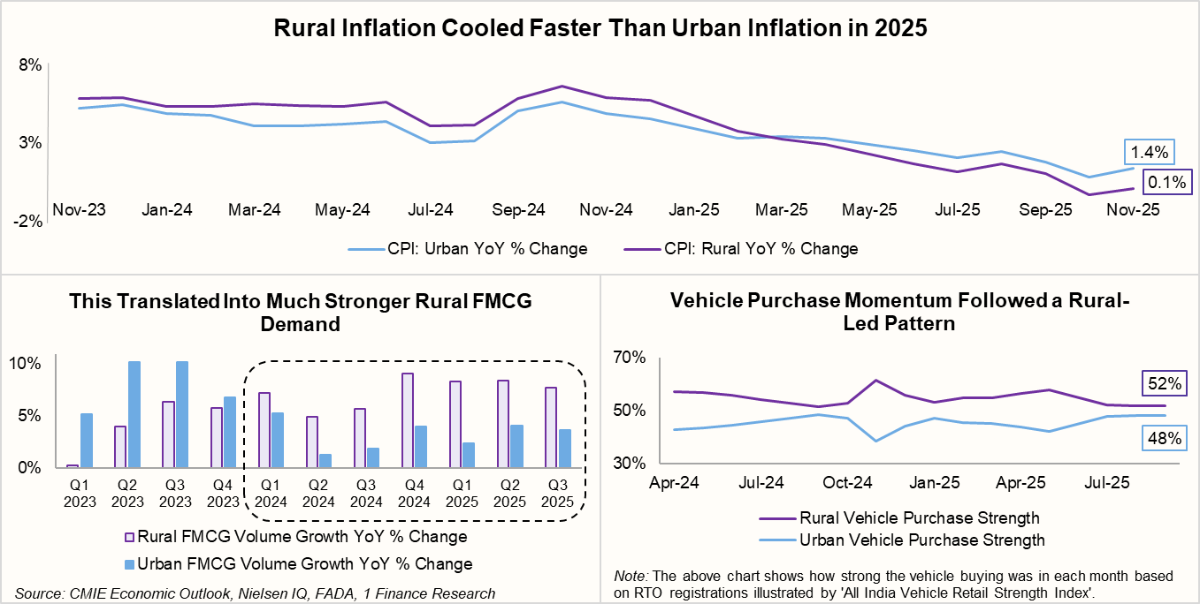
Looking ahead, both rural and urban inflation are expected to stay benign. Combined with RBI rate cuts and GST rate rationalisation, this creates room for demand to broaden from rural recovery toward a gradual urban revival. However, fiscal execution and external conditions will remain key variables to monitor in 2026.
The Rupee and Domestic Flows Weakened Just as Expected
We predicted the Rupee would face significant pressure this year. We expected FX intervention to be limited under the newly appointed RBI governor, unless extreme circumstances arise.
This call proved to be spot on. The Rupee fell 5% against the Dollar and 12% against the Pound. It also dropped 19% against the Euro and 5% against the Yen in 2025.
Moreover, our prediction regarding domestic institutional flows was also accurate. We expected a slowdown based on historical patterns of weaker DII flows during market consolidation.
DII participation remained strong in absolute terms in 2025. This was due to record SIP inflows, strong household savings, and reforms that channelled discretionary income into equities. These domestic buyers successfully absorbed massive selling pressure from foreign investors. But YoY growth moderated to 46% from 183% in 2024, just as we expected.
Four Asset Class Calls That Worked Quite Well
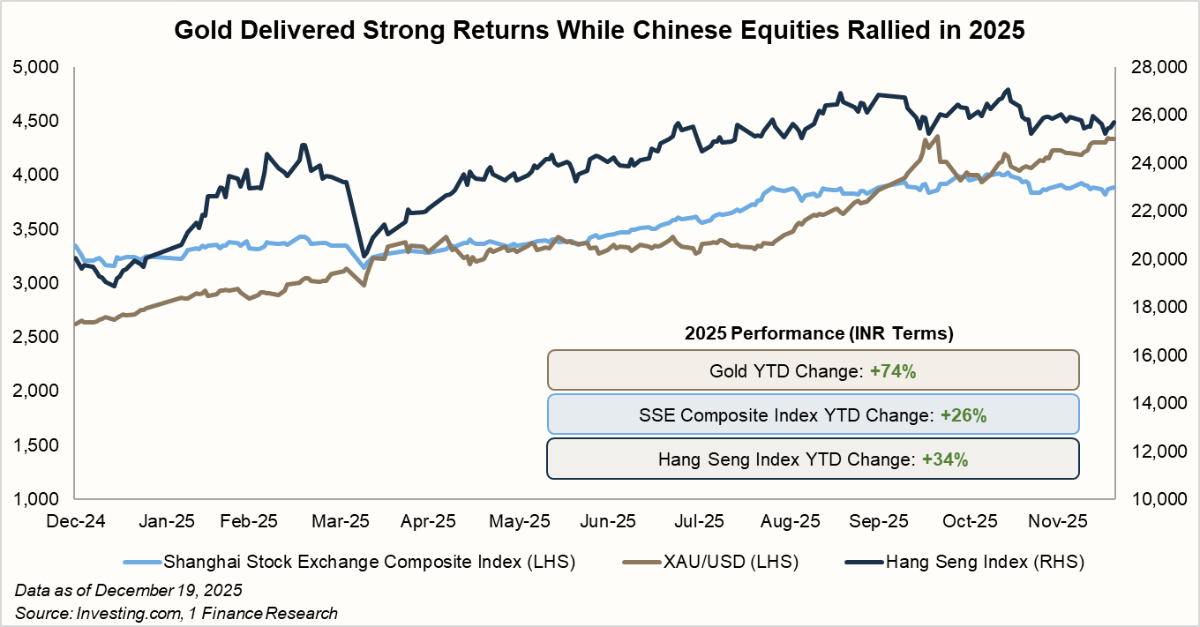
Now let’s look at the asset class calls that worked well, starting with gold. We expected gold prices to rise further in 2025. Rate cuts and strong central bank buying supported this view. This call played out well.
Global central bank purchases touched 634 metric tonnes this year (till Q3 2025). The Fed cut rates by 75 bps, while the RBI delivered 125 bps of cuts. Ongoing tariff uncertainties added to gold’s appeal. Together, these factors drove a 74% return in gold in INR terms.
Another call that worked well was on Chinese equities. We were positive on this asset class from the start of the year. We expected policy support to improve liquidity and revive private sector confidence. Measures announced in late December reinforced this view.
Valuations were also deeply attractive at the time as compared to peer countries. This thesis played out well in 2025. The Hang Seng Index jumped 34% in 2025 (data as of December 19, 2025). Gains were driven by undervalued stocks and renewed strength in Chinese technology.
Our bond strategy played out well this year. We preferred short-term bonds as the rate-cut cycle began, supported by steady foreign inflows following India’s inclusion in global bond indices. Growth concerns kept long-term yields sticky, while short-term yields benefited more from rate cuts.
As a result, short-term debt funds returned nearly 8% on average in 2025 (till December 19), while medium- to long-term options lagged at around 6%.
On the equity front, we correctly prioritised large caps over mid and small caps. We saw mid-caps and small-caps reaching frothy valuations by late 2024. Global uncertainty and currency swings made stable, large companies a safer bet.
Fast forward to now, following a massive sell-off, Indian mid- and small-caps are sitting at more stable valuations than before.
| Category | Nifty 50 | Nifty Midcap 150 | Nifty Smallcap 250 |
|---|---|---|---|
| Current P/E Ratio | 22.6 | 33.0 | 28.5 |
| Last 10-Year Median P/E Ratio | 23.5 | 34.0 | 32.2 |
| YTD Change | 10% | 5% | -8% |
Source: CMIE Economic Outlook, 1 Finance Research
How it was at the start of 2025:
| Category | Nifty 50 | Nifty Midcap 150 | Nifty Smallcap 250 |
|---|---|---|---|
| Current P/E Ratio | 21.5 | 41.3 | 32.7 |
| Last 10-Year Median P/E Ratio | 24.1 | 33.7 | 33.5 |
Source: CMIE Economic Outlook, 1 Finance Research
Two Bets Where We Were Just Partially Correct
Now, let’s look at where we were only partially accurate. At the start of 2025, we gave a 60% probability that the Indian economy would enter a strong recovery phase. (To learn more about macroeconomic phases and how they impact asset class performance, click here.) This was based on cooling inflation, rate cuts, rural demand, and private capex hopes.
We also assigned a 25% probability for India to remain in a transitory slowdown phase if tariffs hit and foreign institutional flows moved out. That scenario played out. Tariffs, rupee depreciation, and foreign outflows pulled momentum back from its peak.
The 1 Finance Macroeconomic Index captured these shifts well; it rose early in the year into a strong recovery, then fell back to a transitory slowdown as high-frequency indicators weakened.
Finally, let’s review U.S. equities. We held a neutral outlook, citing high valuations and fiscal risks. Our caution on fiscal health proved correct. On May 16, 2025, Moody’s downgraded the U.S. long-term rating from Aaa to Aa1. This was historic, as Moody's had held a top-tier rating for the U.S. since 1917.
Our outlook had noted the S&P 500 was overvalued vs. its last 20-year median. Yet, AI and tech leaders outperformed, driving the S&P 500 up 15%. Innovation simply outpaced the valuation concerns we highlighted.
So, What to Expect Now?
As we prepare to release the Global Economic Outlook 2026, we carry valuable lessons from 2025. Most of our calls, Gold, Chinese equities, Indian short-term debt, and rural demand, hit the mark.
However, the year also taught us that innovation (U.S. Tech) can often defy valuation logic and historical patterns.
Several factors will shape 2026. Rural demand should remain strong, with early signs of urban revival emerging. Moreover, lower inflation expectations and additional rate cuts may support broader consumption. The rupee’s path will depend on trade talks, the current account, and RBI intervention. And after the massive sell-off, Indian equities will enter 2026 at better valuations than they did in 2025.
For investors, in 2026, remaining adaptable and diversified will be key to turning macro volatility into opportunity.


