Gold and silver did exactly what they were supposed to do over the past cycle. They protected portfolios during a period marked by inflation uncertainty, geopolitical stress, currency volatility, and rising fragmentation in global trade and finance. Central bank buying surged, real yields softened, and precious metals once again proved their value as portfolio insurance.
That success, however, creates a new question for investors going into 2026. Not whether gold and silver still belong in portfolios, but whether concentration risk within metals has quietly increased, and whether diversification within the metals basket itself needs to evolve.
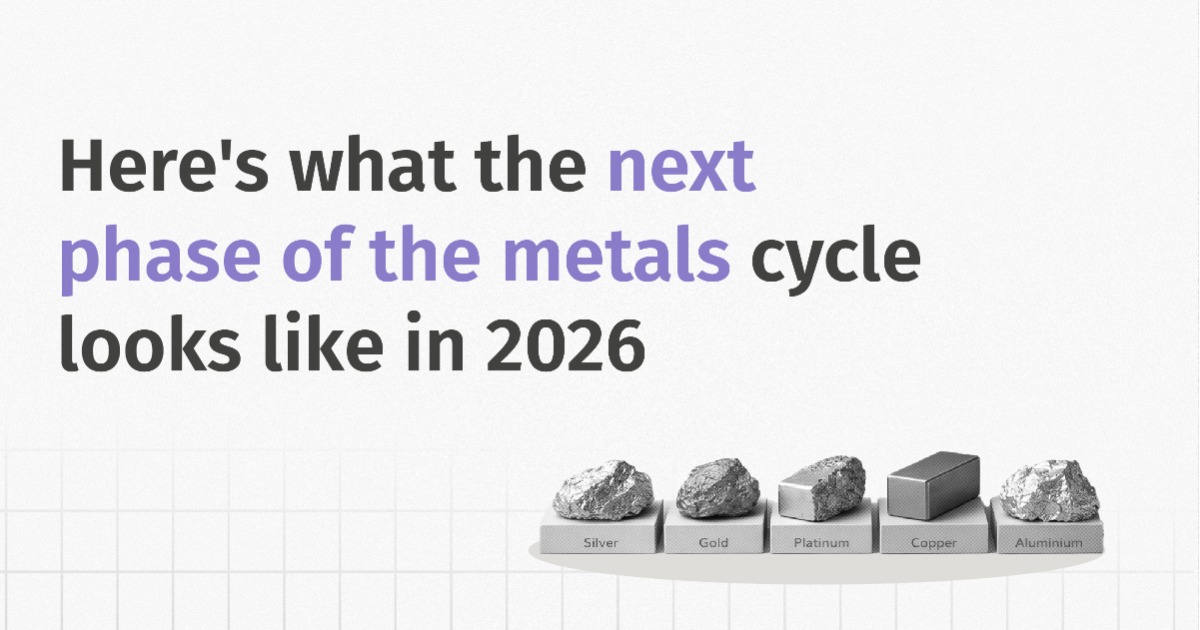
This edition explores that transition. We briefly anchor platinum and palladium, which sit between precious and industrial metals, before focusing on copper, a metal that increasingly reflects where the next phase of the global and Indian investment cycle is headed.
Metals at a Glance
Before diving into detail, the table below offers a snapshot of how different metals fit into portfolios today and where they appear to be positioned in the cycle.
| Metal | Primary Role | What Drove the Last Cycle | Where We Are Now |
|---|---|---|---|
| Gold | Monetary hedge | Inflation, geopolitics, and central bank buying | Late-cycle |
| Silver | Hybrid hedge | Monetary + industrial demand | Mid-to-late |
| Platinum | Transition metal | Auto catalysts, hydrogen optionality | Early recovery |
| Palladium | Cyclical industrial | Auto demand, supply disruptions | Bottoming/volatile |
| Copper | Capex proxy | Electrification, grids, EVs | Early |
This framework sets the context for the diversification argument that follows.
Recommended for you
Readers also explored
The Global Rate Cut Cycle Is Over
India's IT Sector Outlook for FY2026
Gold and Silver Did the Heavy Lifting in 2025
Let’s start with gold and silver because they set the tone for the entire metals cycle in 2026.
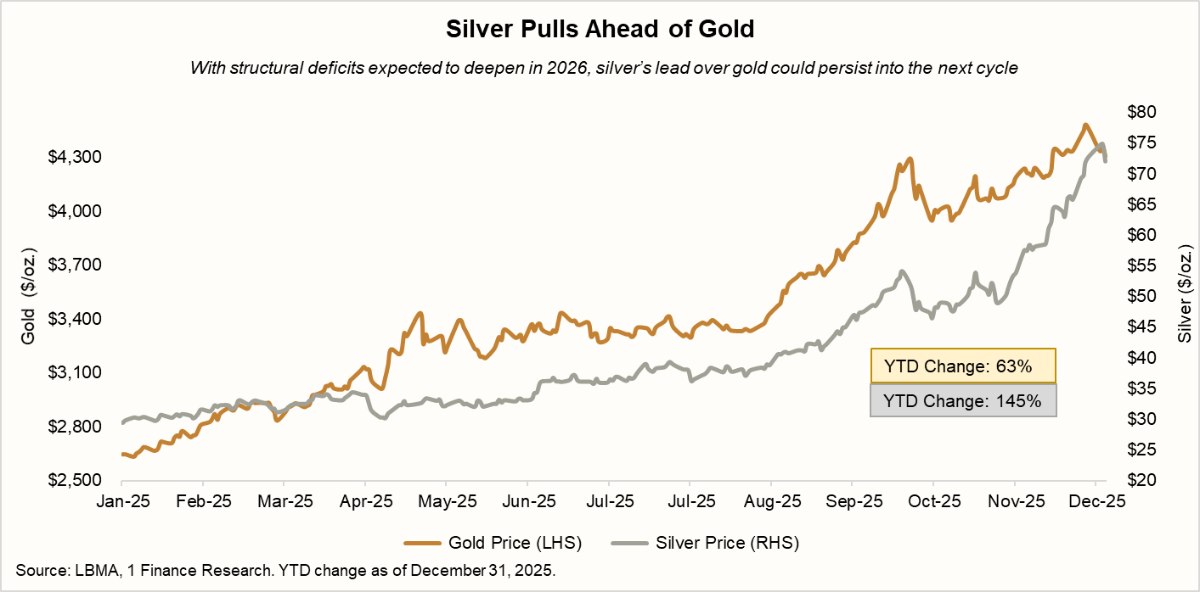
Both metals delivered exceptional returns last year. Gold rose sharply by 63% in 2025, supported by global rate cuts, aggressive central bank buying, and persistent geopolitical uncertainty. Silver went a step further, outperforming gold by 145% YTD gains as its industrial demand kicked in alongside its safe-haven role.
This wasn’t accidental. At the start of 2025, the macro setup was ideal for precious metals. Inflation risks were still present, real yields were falling, and global policy uncertainty remained elevated. Gold did exactly what it is meant to do in such phases: it protected purchasing power and stabilised portfolios.
Silver amplified that move. Unlike gold, silver sits at the intersection of precious and industrial demand. As solar installations, electronics, and energy transition themes gained traction, silver benefited from both fear and growth at the same time. That combination explains why silver’s gains were sharper and more volatile than gold’s.
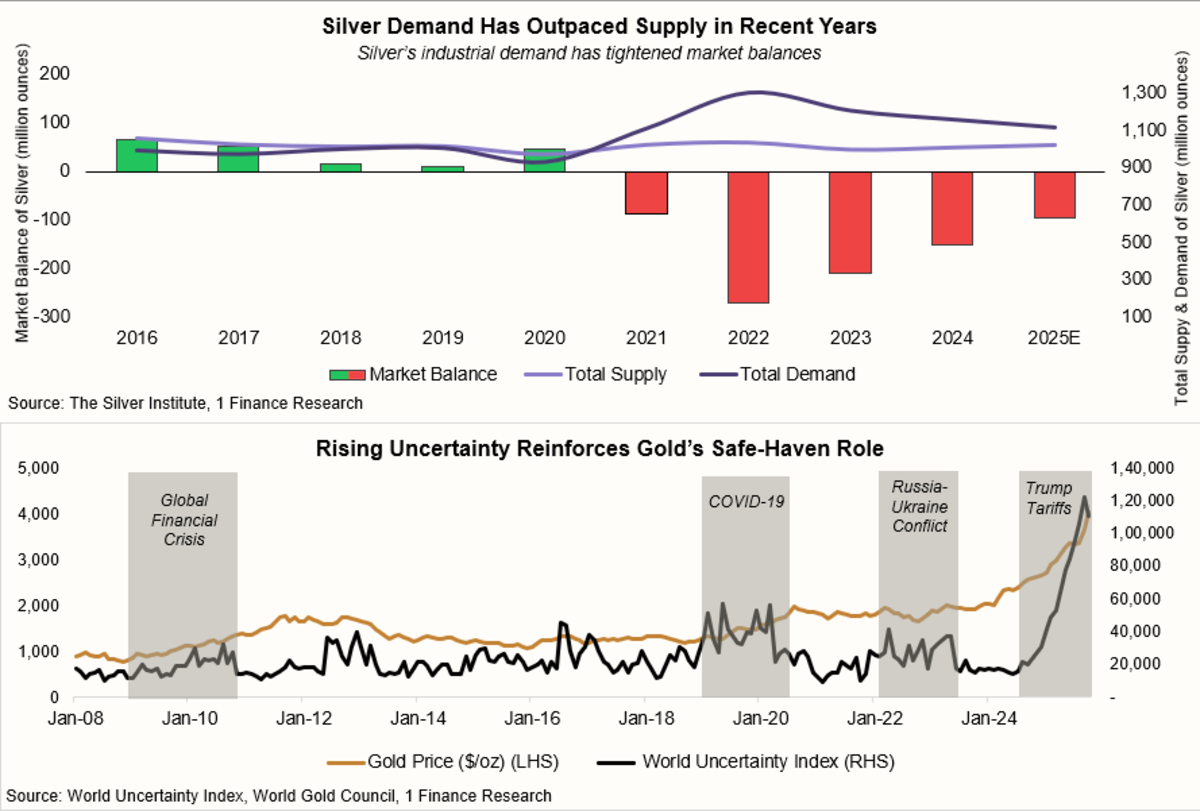
The key takeaway, however, is not just that gold and silver performed well. It is that a large part of their macro re-rating is now behind us. Their role going forward remains important but slightly different. After the strong rally of 2025, both metals should be better viewed as stabilisers rather than fresh return drivers at the margin.
This is why diversification within metals now become relevant.
Platinum and Palladium Have Started to Diverge
While gold and silver were driven largely by macro and monetary factors, platinum and palladium are entering 2026 with very different fundamentals. Their outlook is shaped less by interest rates and more by physical supply and demand.
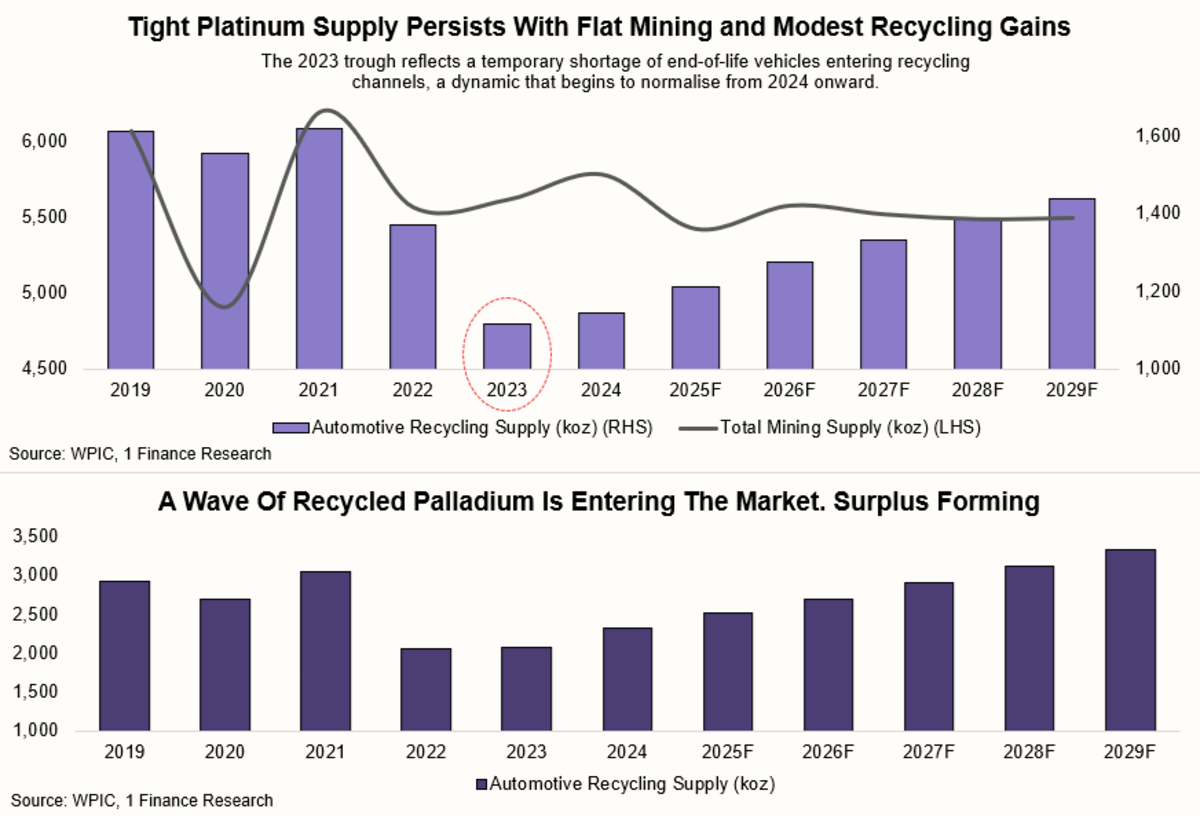
Platinum moves into 2026 with a structural supply deficit still in place. Mine supply has not meaningfully improved, while demand across automotive catalysts, industrial uses, and jewellery continues to hold up. That keeps the platinum market tight heading into the year.
In smaller and less liquid markets like platinum, sustained deficits matter a lot. Even modest imbalances between supply and demand can push prices meaningfully higher. That is exactly what we saw through 2025. The deficit acted as a floor under prices and gradually turned into a tailwind.
Palladium, on the other hand, told a different story.
After years of tight supply and strong automotive demand, the palladium market has begun to move in the opposite direction. Demand growth slowed as substitution toward platinum increased and the penetration of electric vehicles reduced long-term gasoline catalyst demand. At the same time, supply conditions improved.
By 2025, palladium was no longer facing the kind of tightness it once did. Surpluses began to build, or at the very least, deficits narrowed sharply. This shift mattered. Even though palladium prices still moved during the broader metals rally, its fundamentals were no longer as supportive as platinum’s.
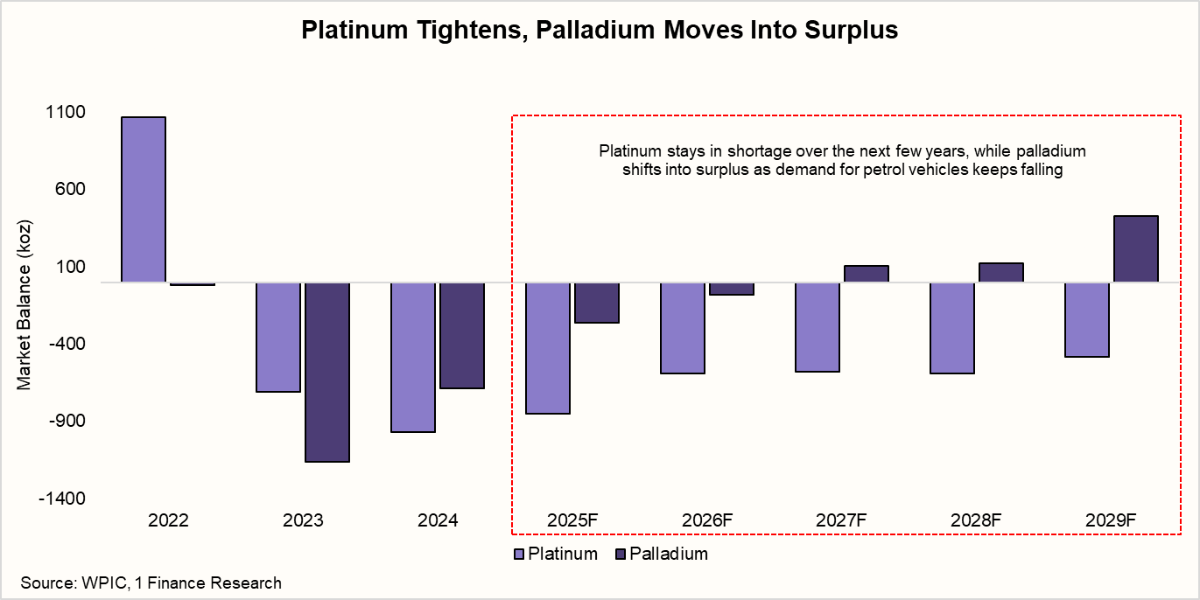
What this highlights is an important point for investors. Not all metals move together, even within the same family. Platinum and palladium are often grouped together, but their cycles can diverge meaningfully based on supply discipline, substitution trends, and end-use demand.
Copper Is Becoming Harder to Ignore in the New Metals Cycle
Copper prices gained momentum through 2025, reviving conversations around a potential copper supercycle. This time, however, the narrative is less about cyclical rebounds and more about structural demand meeting constrained supply.
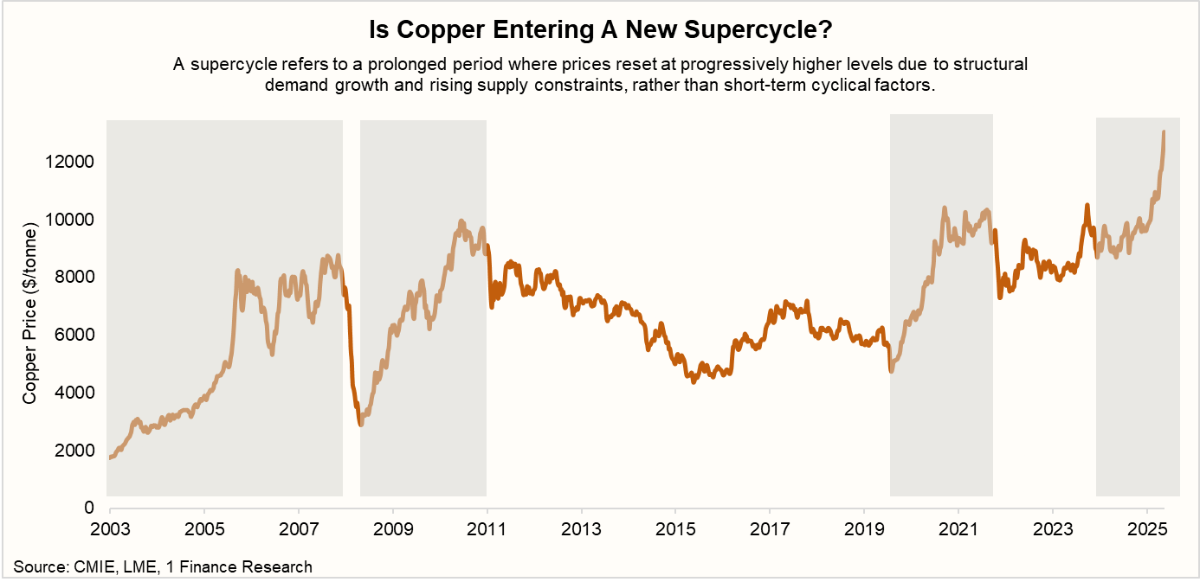
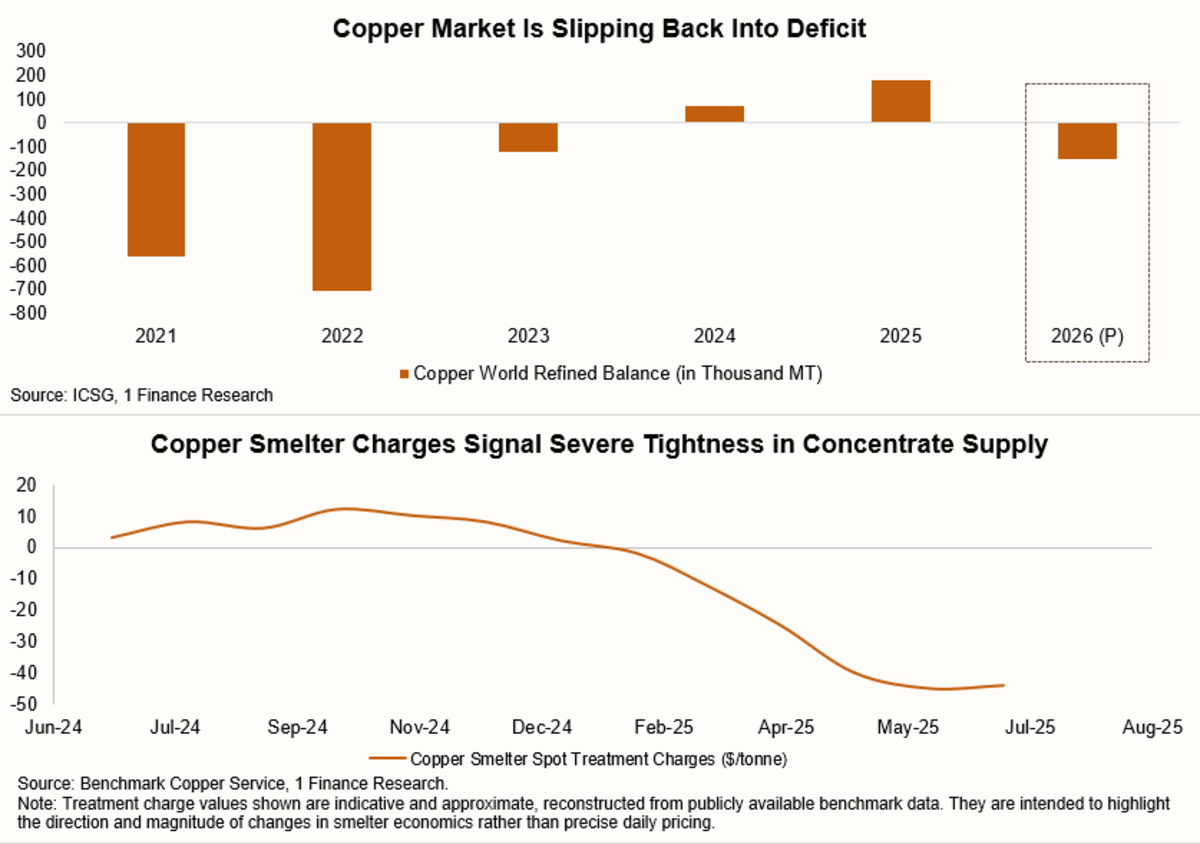
The copper market is moving steadily towards a structural deficit. According to industry estimates, the primary copper supply could fall short by nearly 30 per cent by 2035. Mined output is expected to peak later this decade before declining, weighed down by falling ore grades and a lack of meaningful new discoveries. Ore quality alone has dropped by nearly 40 per cent since the early 1990s.
The stress is already showing up in the physical copper market. One clear sign is what’s happening to treatment and refining charges — the fees smelters earn for processing copper concentrate into metal.
Those charges have fallen sharply and, in some cases, turned negative. In simple terms, smelters are now competing so aggressively for limited concentrate that they are willing to process it at little or no profit. This reflects tight raw material supply and excess smelting capacity, especially in China.
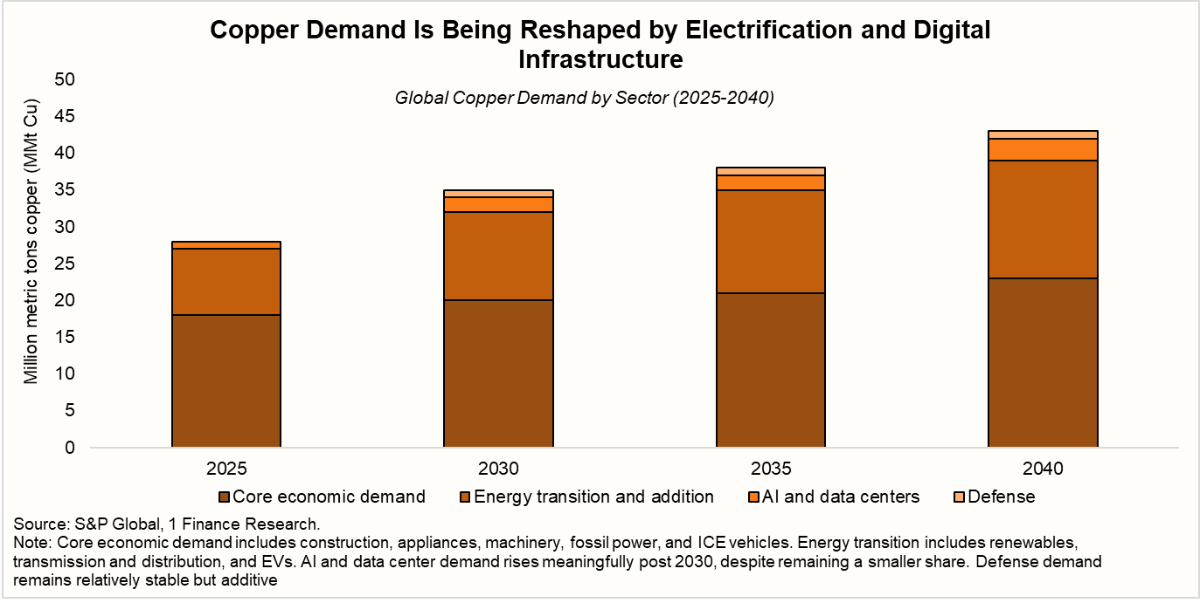
Demand, meanwhile, remains strong. Electrification continues to anchor copper usage across power grids, renewables, and electric vehicles. AI-driven data centres are emerging as a new demand layer, requiring significant copper for power cabling, cooling systems, and infrastructure. With growth increasingly led by India and Southeast Asia rather than property-heavy China, copper is starting to reflect where the next phase of real investment is unfolding.
Putting It Together
What stands out in this phase of the metals story is how much of it is being driven by structural factors rather than short-term macro trades.
Gold reflects long-term uncertainty and reserve diversification. Silver sits between hedging and industry. Platinum and palladium are being reshaped by supply limits and substitution. Copper is tied to rising infrastructure and capital spending.
For investors and advisors, this has clear implications. The next phase of the metals cycle is unlikely to be about one broad, uniform rally. Instead, returns are more likely to come from being selective, understanding which metals are supported by durable supply constraints and steady end-use demand.
Metals exposure going forward is less about making a single directional call and more about balancing roles within the basket. In a cycle shaped more by structure than surprise, diversification within metals is no longer a tactical choice. It’s how portfolios stay aligned with how the global economy is actually evolving.


