2025 was a year of sharp contrasts for markets around the world. Equity indices pushed to new highs despite grappling with persistent uncertainties around trade frictions, geopolitical tensions, tariffs, and supply-chain realignments.
Below is a quick snapshot of how Developed and Emerging Markets performed in 2025:
| Category | Key Takeaways |
|---|---|
| Developed Markets Performance in 2025 |
|
| Emerging Markets Performance in 2025 |
|
We also present an outlook for markets across major economies as we move into 2026:
| Country | Key Takeaways |
|---|---|
| Japan | Positive Outlook for 2026. Japan appears attractive due to its improving earnings trajectory, corporate governance reforms, and geopolitically stable diversification option. |
| UK | Positive Outlook for 2026. The UK remains attractive due to its attractive valuations, high dividend payouts and a globally diversified revenue base. |
| China | Positive Outlook for 2026. China is expected to benefit due to policy easing, selective technology investment support, and relatively attractive valuations. |
| U.S. | Negative Outlook for 2026. Further upside in the U.S. markets may be limited due to elevated valuations, narrow market leadership, and heightened sensitivity to earnings disappointments and policy changes. |
Recommended for you
Readers also explored

Changing Global Economic Dynamics and Domestic Equity Markets

Nifty 50 Companies List 2025 : Top 50 Stocks in India
A Look at Global Market Performance in 2025
Let’s start by looking at how the global markets across the world performed in 2025.
We assess 2025 performance across Developed and Emerging Markets, comparing results with their respective benchmarks.
(Note: The comparison is based on market closing prices of key global indices as of December 31, 2025.)
The MSCI World Index, which covers large-cap and mid-cap equities across developed markets and represents approximately 90% of the investable market capitalisation in these economies, surged 19.5% in 2025.
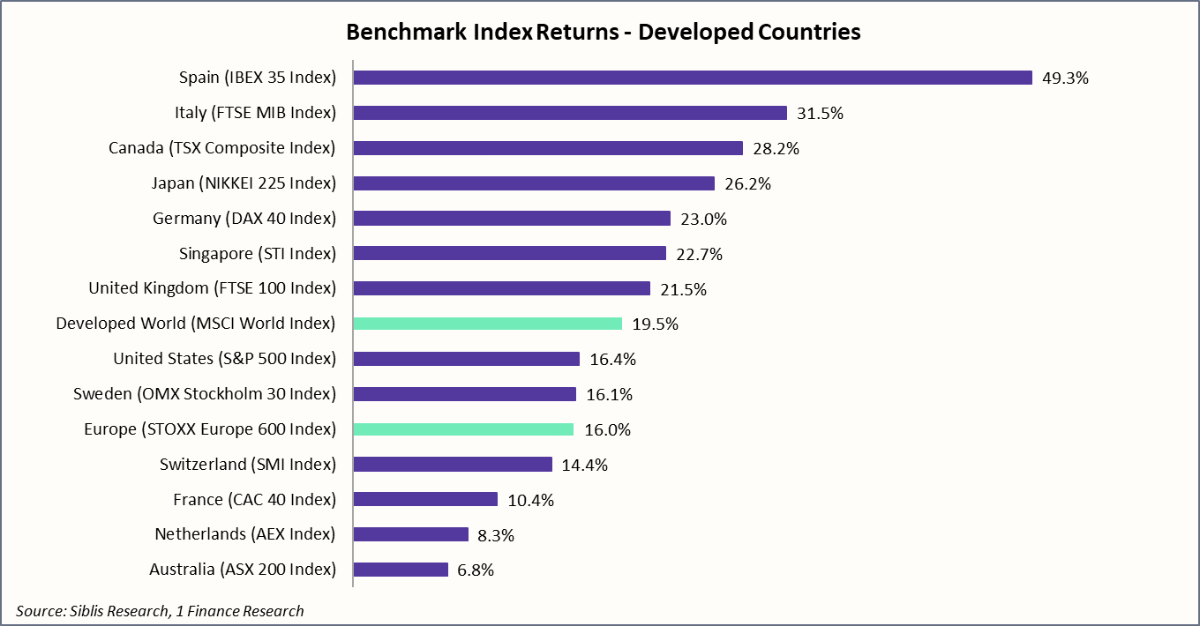
Within the developed markets, Spain led with 49.3% gains, followed by Italy (31.5%), Canada (28.2%), and Japan (26.2%).
In contrast, the MSCI Emerging Markets Index, which represents nearly 85% of the investable market capitalisation across major emerging economies, rose 30.6% in 2025.
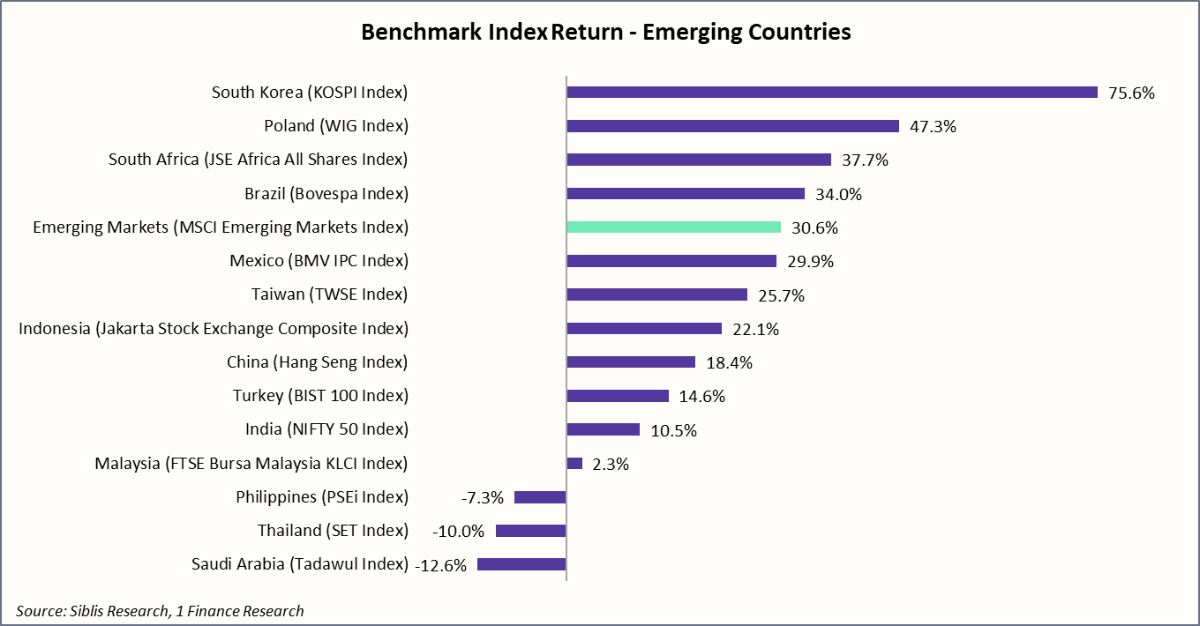
Performance within the index was also highly uneven. South Korea led decisively with a 75.6% gain, followed by Poland (47.3%), South Africa (37.7%), and Brazil (34.0%).
Both India (+10.5%) and China (+18.4%) underperformed the broader emerging markets index.
Let’s review the key factors that shaped index performance across major global economies in 2025, along with our outlook for markets as we head into 2026.
Reviewing 2025 and Looking Ahead to 2026
Japan (Nikkei-225)
Japan’s Nikkei 225 was a steady outperformer, delivering a 26.2% return in 2025. As reflected in the chart below, its trailing twelve-month (TTM) EPS grew 11% in Dec-25. As of Dec-25, the Nikkei-225 continues to trade below its 25-year median P/E of around 19.5x, with valuations at approximately 17.9x.
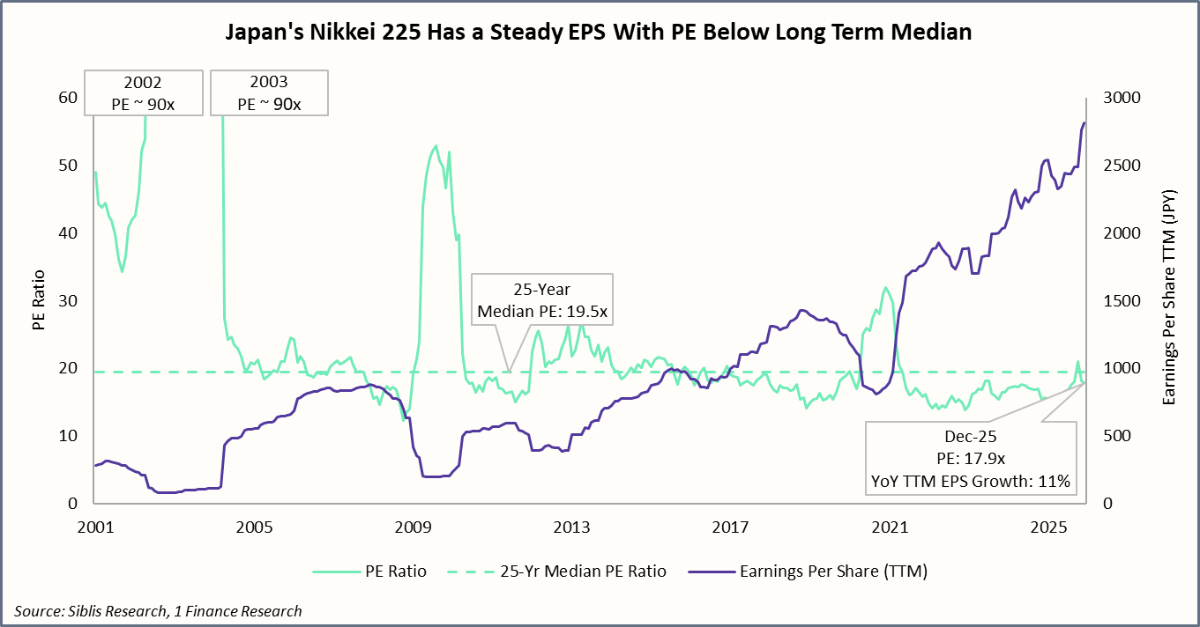
Heading into 2026, the Nikkei-225 stands out in terms of fundamentals, due to its attractive valuations and earnings recovery as highlighted above.
Furthermore, Japan’s corporate governance reforms will boost dividends and buybacks, and also encourage better balance-sheet discipline, allowing investors to benefit from stronger earnings quality and more consistent shareholder returns.
Japan will also benefit from a stable geopolitical position. It is viewed as a reliable partner in global supply chains and a relatively neutral destination for capital amid rising US-China tensions, enhancing its appeal as a diversification market.
United Kingdom (FTSE-100)
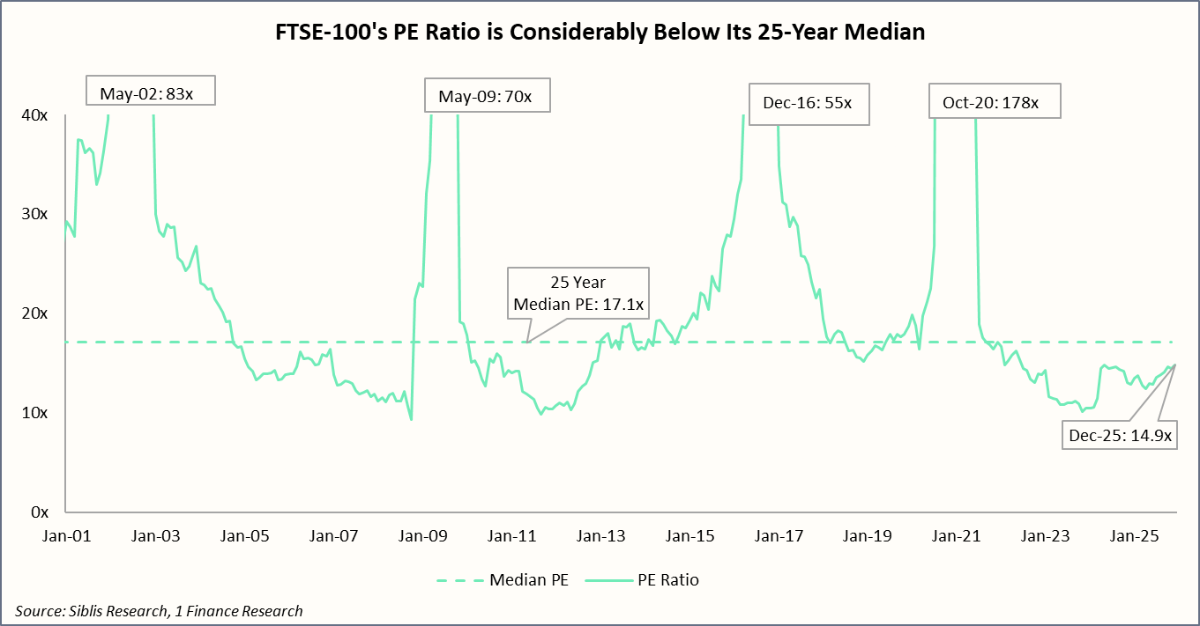
The UK’s FTSE-100 also gained 21.5% in 2025, ahead of the MSCI Developed World Index. As of Dec-25, it trades at a PE of 14.9x, well below its 25-year Median PE (17.1x) as highlighted in the chart below:
Despite slower economic growth in the UK, FTSE’s global revenue base, high dividend payouts, and defensive sector exposure make the index an attractive bet as we head into 2026.
China (Hang Seng Index)
China’s Hang Seng Index rose 18.4% in 2025, largely supported by policy announcements, including targeted fiscal measures and monetary easing. However, its corporate earnings remain below 2022 levels, as shown below:
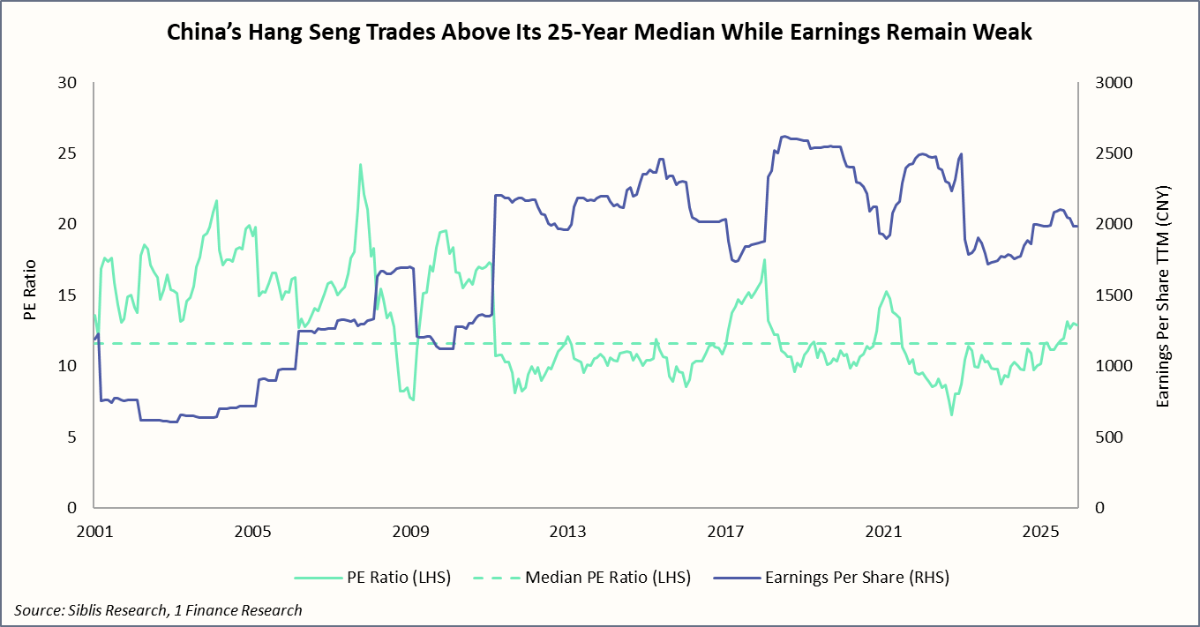
Heading into 2026, China’s outlook remains positive, supported by monetary and fiscal easing, rising investment in AI and technology, and attractive valuations with respect to global peers.
At the same time, weak consumer demand, persistent real estate sector stress, and geopolitical risks remain important downside risks to monitor, as they could constrain earnings growth and market performance.
United States (S&P 500)
The S&P 500 closed 2025 with a PE Ratio of 25.4x, entering a zone where history begins to whisper caution.
The chart below shows where current valuations stand. With the PE ratio at 25.4x, the S&P 500 sits at the 89th percentile of the past 25 years, indicating elevated valuations and higher sensitivity to earnings disappointments.
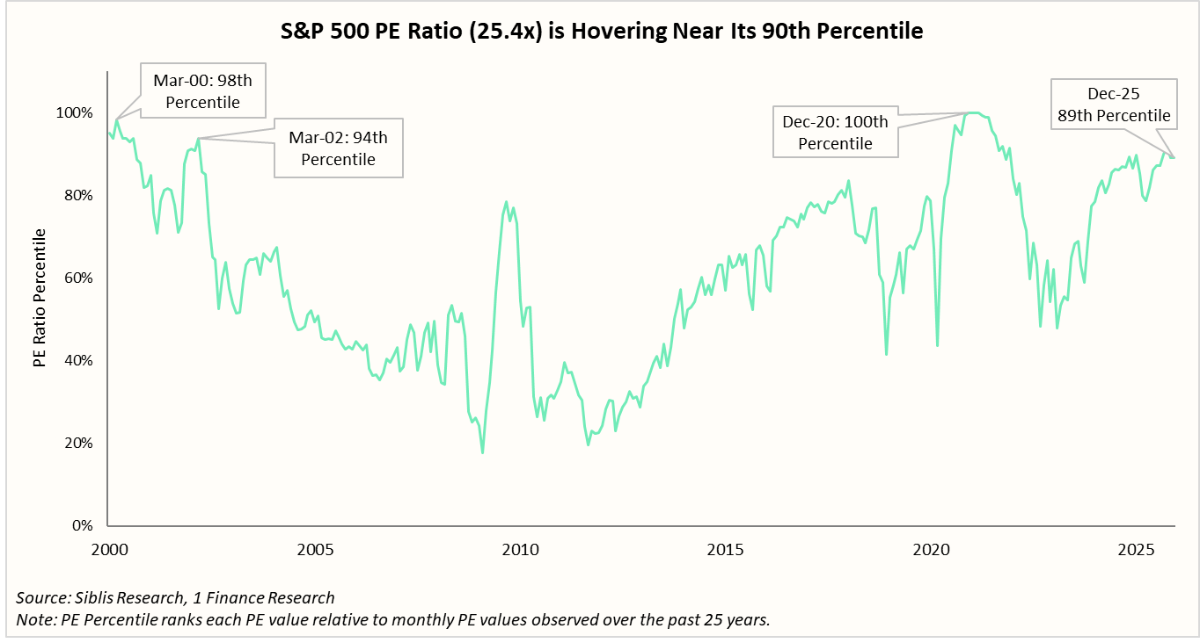
Therefore, our outlook for the U.S. remains negative. Such high valuations leave little margin for error and limited upside potential. Further, the market performance is increasingly driven by a narrow group of seven large technology stocks (The Magnificent-Seven).
This concentration amplifies downside risks, as any earnings disappointment or policy shift affecting these leaders could have an outsized impact on broader market returns.
Concluding Remarks
As global markets head into 2026, investors worldwide face a common set of risks that cut across regions. These would be around geopolitical tensions, uncertainty around trade and supply chains, which could influence corporate earnings and index returns across markets.
In such an environment, Japan and the UK appear relatively well-positioned. Japan benefits from an improving earnings trajectory, structural corporate governance reforms, and its role as a geopolitically stable diversification market. The UK, despite slower domestic growth, offers attractive valuations and a globally diversified revenue base that limits downside protection.
China’s outlook remains positive, as we expect policy support and technology investment to continue to drive index gains. However, weaker consumption and persistent property-sector stress might limit its upside.
In contrast, our outlook for the U.S. remains negative due to its elevated valuations and concentrated market leadership, increasing sensitivity to earnings and policy shocks in 2026.