The latest escalation between the United States, Israel and Iran has pushed an already fragile geopolitical situation closer to a global economic flashpoint. What began as a regional confrontation now threatens one of the most critical energy corridors in the world — the Strait of Hormuz.
In our Global Economic Outlook 2026, we had already identified escalating tensions in the Middle East as a high-risk scenario for global energy markets. The events now unfolding in the region show how quickly such risks can translate into real economic consequences.
For India, this is not a distant geopolitical story. It is unfolding along one of the main supply routes that keeps the country’s economy running.
| Key Takeaways |
|
|
|
|
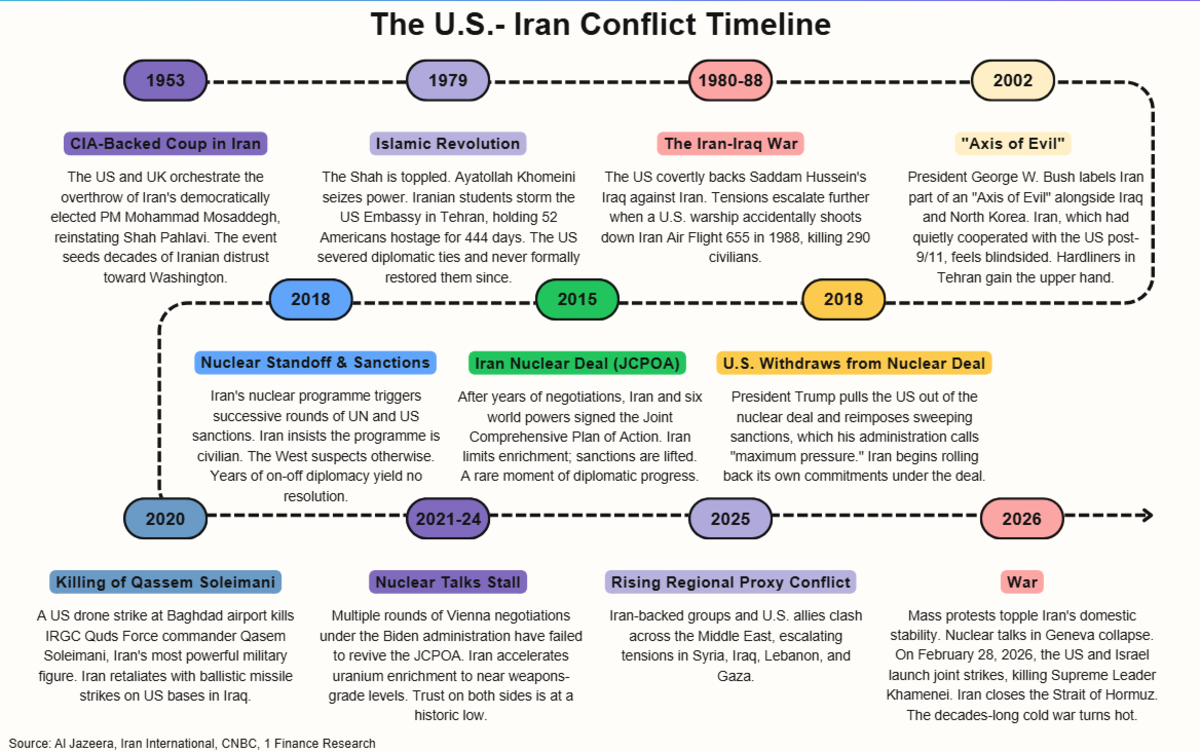
A Conflict Decades in the Making
The U.S.-Iran conflict traces back to 1953, when the U.S. backed a coup ousting PM Mohammad Mosaddegh after Iran's oil nationalisation, restoring the Shah but breeding resentment. Tensions exploded post-1979 Islamic Revolution, with Ayatollah Khomeini's anti-U.S. stance and the Tehran embassy hostage crisis.
Since then, tensions have periodically surged, from sanctions and nuclear disputes to proxy conflicts across the Middle East.
The latest escalation began with internal unrest inside Iran and eventually led to coordinated strikes by the United States and Israel on Iranian nuclear and military infrastructure. Within hours, Supreme Leader Ali Khamenei was confirmed dead, ending a 36.6-year reign and setting off a chain of events that has reverberated across the globe.
That threat has immediate consequences for global energy markets.
Why the Strait of Hormuz Matters
The Strait of Hormuz is one of the most critical maritime chokepoints in the global energy system. This narrow 21-mile-wide passage between Iran and Oman carries nearly 20% of the world’s oil supply and around 15% of global LNG trade.

Most Gulf producers rely heavily on this route to export crude, making it a central artery for global oil flows. But the destination of that oil tells an equally important story.
Recommended for you
Readers also explored
The Global Rate Cut Cycle Is Over

Currency in Circulation: How Much Money Exists in the World?
| The Strait of Hormuz Remains the Primary Export Route for Gulf Oil | ||||||
|---|---|---|---|---|---|---|
| Volume of crude oil and petroleum products transported through the Strait of Hormuz, by country of origin, 2020 - 1Q2025 (million b/d) | ||||||
| 2020 | 2021 | 2022 | 2023 | 2024 | 1Q25 | |
| Saudi Arabia | 6.2 | 6.3 | 6.8 | 6.2 | 5.5 | 5.3 |
| United Arab Emirates | 1.8 | 1.8 | 2.2 | 2.1 | 1.9 | 1.8 |
| Iraq | 2.9 | 2.9 | 3.2 | 3.2 | 3.2 | 3.2 |
| Kuwait | 1.9 | 1.8 | 1.8 | 1.6 | 1.3 | 1.4 |
| Qatar | 0.8 | 0.6 | 0.7 | 0.7 | 0.6 | 0.6 |
| Iran | 0.4 | 0.8 | 1.0 | 1.5 | 1.4 | 1.5 |
| Other | 0.3 | 0.2 | 0.3 | 0.3 | 0.4 | 0.3 |
The majority of shipments passing through Hormuz head towards Asia. China is the largest importer of oil flowing through the strait, receiving more than 5 million barrels per day. India follows at roughly 2 million barrels per day, with Japan and South Korea close behind.
| Asia Is the Main Destination for Oil Passing Through the Strait of Hormuz | ||||||
|---|---|---|---|---|---|---|
| Volume of crude oil transported through the Strait of Hormuz, by destination 2020 - 1Q2025 (million b/d) | ||||||
| 2020 | 2021 | 2022 | 2023 | 2024 | 1Q25 | |
| China | 4.0 | 4.2 | 4.5 | 5.0 | 4.8 | 5.4 |
| India | 2.2 | 2.3 | 2.4 | 2.0 | 1.9 | 2.1 |
| South Korea | 1.7 | 1.4 | 1.7 | 1.7 | 1.7 | 1.7 |
| Japan | 1.9 | 1.8 | 1.9 | 1.7 | 1.5 | 1.6 |
| Other Asia | 2.0 | 2.1 | 2.2 | 2.1 | 2.1 | 2.0 |
| Europe | 0.6 | 0.5 | 0.9 | 1.0 | 0.7 | 0.5 |
| United States | 0.6 | 0.6 | 0.7 | 0.5 | 0.5 | 0.4 |
| Saudi Arabia | 0.3 | 0.4 | 0.5 | 0.3 | 0.2 | 0.0 |
| Other | 1.0 | 1.1 | 1.1 | 1.3 | 0.9 | 0.6 |
For India, this geographic reality creates a significant strategic vulnerability.
India imports 85-90% of the crude oil it consumes, and a large share comes from Gulf producers such as Iraq, Saudi Arabia and the UAE. Roughly half of India’s oil imports, around 2.5 million barrels per day, pass through the Strait of Hormuz.

India’s economic ties with the Middle East are extensive, which means developments in the region tend to have direct spillover effects.
Taken together, these connections mean that instability around the Strait of Hormuz is not simply a geopolitical concern. For India, disruptions in the region can quickly translate into higher energy prices, financial market volatility, trade disruptions, and pressure on the broader economy.
India’s Macroeconomic Sensitivity to Oil Price Shocks
Because India depends so heavily on imported oil, changes in crude prices quickly feed through the economy.
When crude prices rise, the impact spreads quickly through the economy. Higher fuel costs push up transportation, electricity, and logistics expenses, which eventually feed into food and consumer prices. For a major energy importer like India, sustained increases in oil prices therefore create broad inflationary pressures, a wider current account deficit, and downward pressure on the rupee.
The table below illustrates the estimated macroeconomic impact of a $10-$30 increase in crude oil prices.
| How Oil Price Shocks Transmit Through India’s Economy | ||||
|---|---|---|---|---|
| Crude Shock | Domestic Fuel Price Rise | CPI Impact | CAD Widening (% of GDP) | Rupee Depreciation Pressure |
| +$10/bbl | ~7-8% | ~0.6-0.7% | ~0.4-0.5% | ~0.8-1.0% |
| +$20/bbl | ~15-16% | ~1.2-1.4% | ~0.8-1.0% | ~1.5-2.0% |
| +$30/bbl | ~22-24% | ~1.8-2.0% | ~1.2-1.5% | ~2.5-3.5% |
Note: Estimates are illustrative and based on standard macro sensitivities for India.
At the Hormuz crisis base case of +$30/bbl, India faces inflation rising by nearly 2 percentage points, a current account deficit approaching 2.5% of GDP.
What History Says About Markets & War
Markets usually react quickly to geopolitical shocks. Investors reassess risks, oil prices move sharply, and equities often fall in the immediate aftermath of major conflicts.
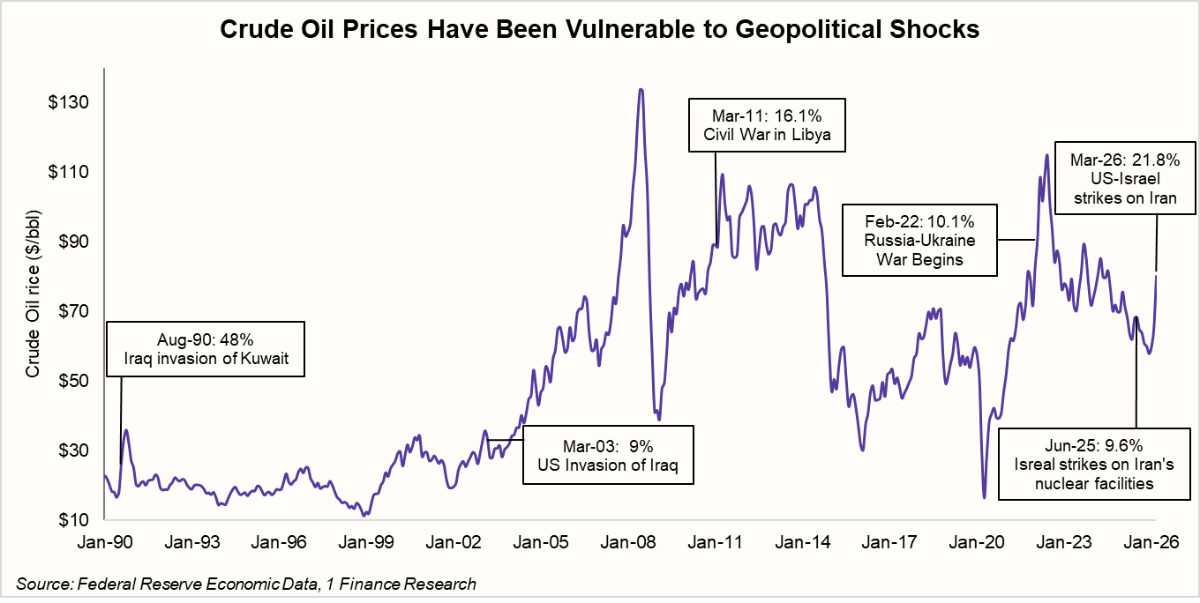
However, history suggests that these reactions are usually short-lived. Once the initial shock fades and the scale of the conflict becomes clearer, markets tend to stabilise and refocus on underlying macroeconomic fundamentals. The table below highlights how Indian equities have reacted to several major geopolitical events over the past two decades:
| Event | NIFTY50 Returns Post-Conflict | |||
|---|---|---|---|---|
| 1-Day Return | 1-Week Return | 1-Month Return | 1-Year Return | |
| 2001 WTC Attacks (11 Sep 2001) | -4.0% | -12.0% | -6.7% | -2.4% |
| US Invasion of Iraq (20 Mar 2003) | 0.5% | -1.1% | -8.2% | 68.3% |
| Arab Spring- Libya Invasion (17 Feb 2003) | -1.6% | -5.1% | -1.8% | 0.3% |
| Russian Invasion of Ukraine (24 Feb 2022) | -4.8% | -4.8% | 1.1% | 2.9% |
| Israel airstrikes on Iran Nuclear Facilities (12 Jun 2025) | -0.7% | -0.4% | 1.1% | - |
Across most events, the pattern is consistent. Markets often decline in the immediate aftermath of geopolitical shocks, but the impact tends to fade over time. Over longer horizons, equity performance is typically driven more by domestic growth, liquidity conditions, and corporate earnings than by geopolitical headlines.
The broader lesson from past episodes is that geopolitical shocks tend to produce sharp but temporary market reactions, while longer-term market performance remains closely tied to economic fundamentals.
So, Where Can India Source Oil Now?
India’s ability to manage a disruption in the Strait of Hormuz will depend on how quickly it can secure alternative crude supplies. Current estimates suggest the country holds roughly 45–50 days of crude inventories, including commercial stocks and Strategic Petroleum Reserves of about 5.3 million tonnes.
But that buffer only buys time. If disruptions persist, India would need to quickly find alternative suppliers outside the Gulf.
| India’s Alternative Oil Supply Options | ||||
|---|---|---|---|---|
| Country | Shipping Route | Availability | Scalability | Key Constraint |
| Russia | Baltic Sea, Arctic and Far East ports | Immediate | High | US sanctions pressure; deliveries already down 30% in Jan 2026. Politically loaded at the worst possible moment. |
| U.S.A | Atlantic shipping routes | Available | Moderate | Longer voyage (35–40 days vs the Gulf's 7–10). Lighter crude grades require refinery adjustment. Freight costs are higher. |
| West Africa | Atlantic shipping routes | Available | Moderate-High | Limited spare export capacity globally. Best short-term bet, no political baggage, good grade fit for Indian refineries. |
| Latin America (Brazil, Guyana) | Atlantic shipping routes | Limited currently | Low | Voyage time 25–30 days. Right crude grades for Indian refineries. Best long-term play, contracts placed today arrive in 6–8 weeks. |
Even with these alternatives, replacing Gulf oil quickly would be difficult. Refinery configurations, logistics and limited global spare capacity all constrain how rapidly supply can be shifted.
Geopolitical crises often feel unpredictable, but the way they affect markets is usually more familiar. Oil prices rise, volatility spikes, and investors look for clarity. For India, the real challenge lies in its energy dependence. When disruptions threaten the Strait of Hormuz, the effects travel quickly through inflation, trade balances and currency markets.
To understand how geopolitical risks like these could shape global markets and your investment decisions, explore our Global Economic Outlook 2026 here.