US market exceptionalism, the idea that US markets deliver better returns, was put to a test in 2025. Higher valuations, reliance on a few large companies, and weaker performance when compared with other developed markets and assets like Gold raised doubts about the US market dominance.
This blog explores these changes by looking at concentration risks within the US market, comparing market performance with gold, and revisiting the tech-bubble period to understand what this may mean for future returns and market swings.
| Key Takeaways |
|---|
|
|
|
|
|
|
2025 Performance Comparison of Key US-Indices
2025 proved a challenging year for the US markets, marked by higher starting valuations and growing uncertainties due to rising macro, fiscal, and geopolitical uncertainties.
In 2025, the major US indices underperformed most of the key developed-market peers, such as the FTSE-100 (UK, +21.5%), Nikkei 225 (Japan, +26.2%), DAX 40 (Germany, +23.0%), as well as the broader MSCI World Index (+19.5%).
| Benchmark Index | Current PE Ratio | 25-Yr Median PE | 1Yr Return (2025) | EPS Growth (2025) | Category |
|---|---|---|---|---|---|
| S&P-500 Index | 25.4x | 18.9x | 16.4% | 12.9% | Overvalued |
| NASDAQ-100 Index | 32.3x | 27.2x | 20.2% | 20.3% | Overvalued |
| Russell-2000 Index | 32.8x | 36.7x | 11.3% | 4.8% | Highly Overvalued |
| Russell-1000 Growth Index | 39.3x | 22.6x | 17.9% | 16.3% | Highly Overvalued |
| Russell-1000 Value Index | 20.8x | 16.5x | 13.6% | 7.3% | Fairly Valued |
Within the US markets, the Nasdaq-100 emerged as the clear outperformer when compared with the MSCI World Index. Its index gains also matched the underlying earnings growth. In contrast, the S&P-500 and the Russell indices underperformed the global markets, as they started the year at elevated valuations. This left little room for profits to drive returns, increasing the gap between market prices and actual earnings growth.
Higher P-E multiples across the US markets are not a uniform phenomenon, but vary disproportionately across sectors and companies. At the company level, the elevated valuations are mainly driven by a narrow group of mega-cap leaders known as the Magnificent Seven.
Recommended for you
Readers also explored

India's IT Sector Outlook for FY2026

Currency in Circulation: How Much Money Exists in the World?
The Elevated Concentration Risks Within S&P-500
The Magnificent Seven represents the most expensive segment of the US equity market, carrying the highest valuation multiples and an outsized share of index earnings and returns.
Their dominance stems from their strong profitability and AI-driven growth, but also heightens the concentration risk, as overall market performance is tied to a narrow group of stocks. The group includes Apple, Microsoft, NVIDIA, Alphabet, Meta Platforms, Amazon, and Tesla.

Together, the Magnificent Seven account for ~ 34% of the S&P 500’s market capitalisation in 2025, up from roughly 10% in 2014. Earnings growth for these companies has been supported by strong demand for AI infrastructure, continued investment in cloud and AI technologies, and a gradual recovery in digital and advertising services.
This has translated into an earnings growth of ~37% in 2024, with markedly lower forecasts of roughly 22% in 2025 and 23% in 2026, as depicted in the chart below.
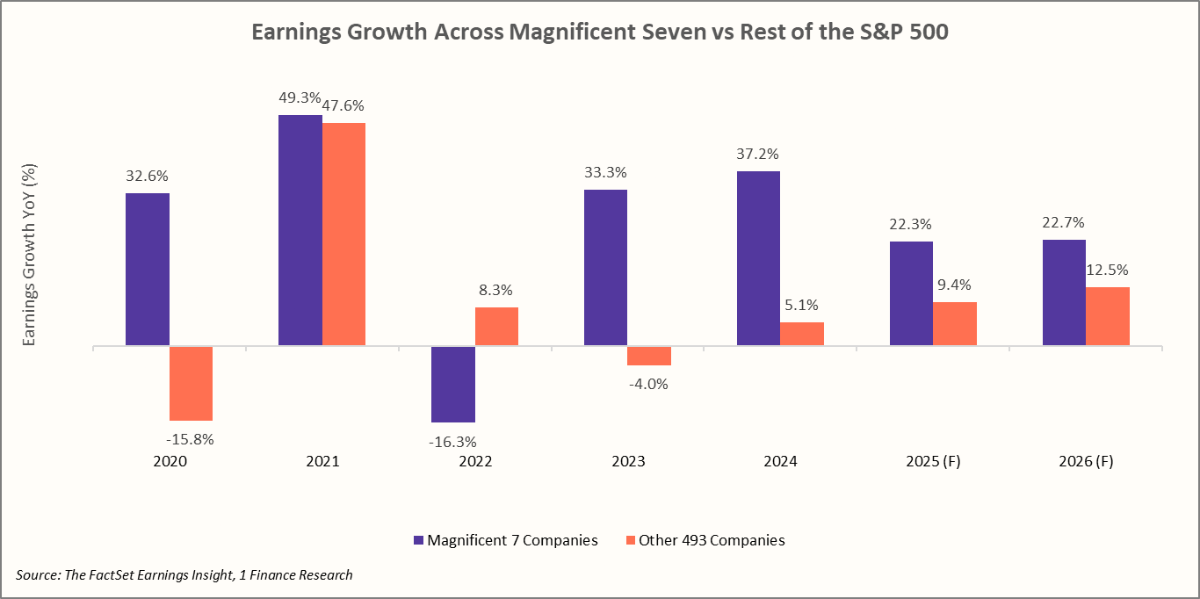
In summary, this narrow group has accounted for nearly 75% of index returns, about 80% of aggregate earnings growth, and close to 90% of capital spending in recent years, highlighting the growing concentration risk within the broader market.
Looking into 2026, any slowdown in earnings growth among the Magnificent Seven poses a clear risk to the broader index. Their outsized role in S&P 500 earnings means even mild disappointments could drive valuation compression and higher volatility.
Evaluating the S&P 500’s Performance Relative to Gold
Building on the idea of elevated valuations and concentration risks, let us see how valuing the S&P-500 in terms of gold provides a longer-term perspective on whether current equity prices are genuinely stretched or largely a function of monetary conditions.
Gold is often viewed as a form of “real money,” while equity indices like the S&P 500 represent paper claims on future corporate earnings. The S&P/Gold ratio indicates how many ounces of gold are needed to buy a unit value of the index. A high ratio signals strong confidence in equities relative to Gold.
A falling S&P/Gold ratio suggests that equities are losing ground to gold, which often occurs during periods of tighter liquidity, higher inflation, or weaker growth expectations. Historically, sharp declines were seen after the dot-com bust and during the global financial crisis, when equity valuations corrected and investors sought monetary safety over paper wealth.
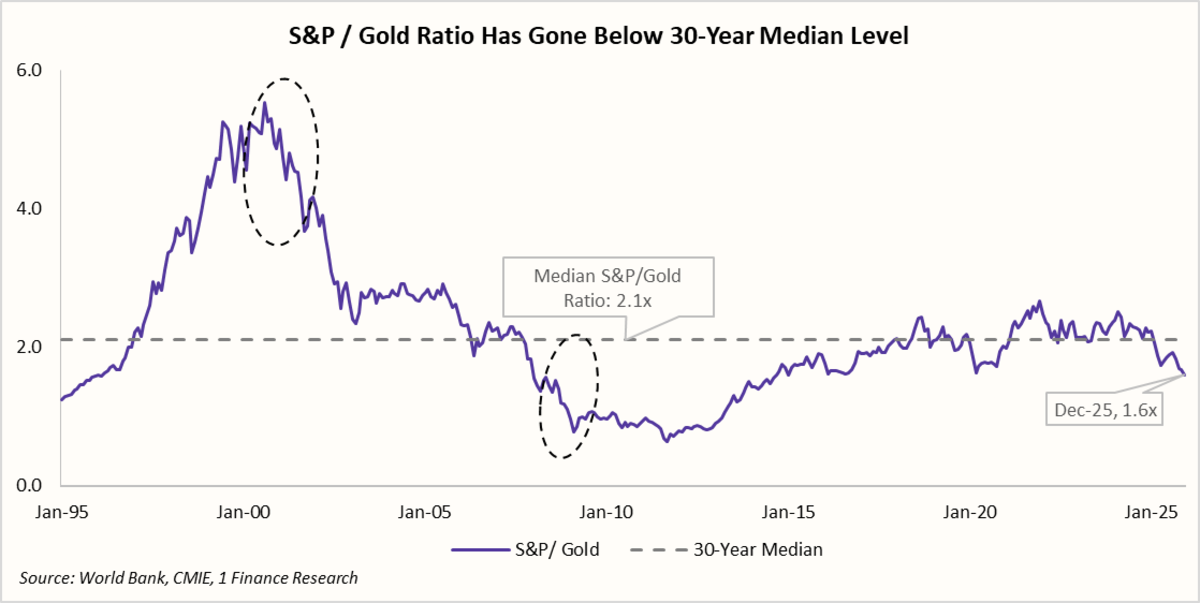
The S&P 500 looks like it has grown a lot on paper. But when you compare it with appreciation in gold, those gains are much smaller. In simple terms, equities haven’t increased real buying power by much; most of the rise just reflects inflation and a weaker currency, not true wealth growth.
Given such elevated valuations, concentration risks and rising macro uncertainties, such as fiscal strains, geopolitics, and tariffs, it is useful to compare the current levels with those of the tech-bubble era, a period when optimism outpaced fundamentals.
How Today’s Market Valuations Compare with the Dot-Com Era
The tech-bubble period of 1999-2000 was marked by extreme valuation excess, widespread speculations, weaker earnings, and heavy reliance on future growth narratives that ultimately made markets vulnerable to sharp and prolonged corrections.
| Valuation Metric | Current Cycle (Dec-25) | Tech Bubble (Mar-00) | Interpretation / Risk Signal |
|---|---|---|---|
| PE Ratio | 25.4x, ~90th percentile1 | 29x, ~98th percentile1 | Elevated but below bubble extremes. |
| Forward PE Ratio | ~ 22.8x | ~ 24x | Optimism is priced into future earnings. |
| CAPE Ratio | ~ 35.0x | ~ 43.9x | Long-term return expectations compressed. |
| Market Cap / GDP | ~ 217% | ~ 135% | Disconnect between markets and the real economy. |
| S&P / Gold Ratio | 1.6x | 5.2x | Suggests weaker real returns today. |
| Index Concentration | Mag-7: 34% of the index | Top 10: ~29% of the index | Higher concentration risk today. |
| Earnings Breadth | Narrow, driven by the Mag-7 | Relatively broader, across tech, telecom and cyclical sectors | Dependence on a few stocks. |
| Investor Sentiment | High optimism, low fear | Extreme euphoria | Complacency risk building. |
| Liquidity Dependence | High (rate-cut expectations) | High (easy money) | Vulnerable to policy shifts. |
The percentile measure compares that period’s P-E ratio with monthly observations over the past 25 years
Overall, a comparison with the tech-bubble era suggests that today’s market is more balanced than in 2000, supported by stronger earnings, better cash flows, and far less speculative excess.
However, the US equity valuations are approaching late-cycle, tech-bubble-like levels. At this stage, markets tend to be more mature, upside potential reduces, and even modest earnings disappointments can trigger sharper corrections and higher volatility.
Taken together, these points point to a likely phase of lower forward returns and elevated volatility, where fundamentals matter more and valuation discipline becomes critical.
Concluding Remarks and a Note on Diversification
An assessment of the S&P 500 shows that its returns are driven by a small group of mega-cap stocks, reducing the diversification benefits of having a broader index exposure in our portfolio. Rising concentration ties portfolios to a single growth theme, such as that of AI, increasing vulnerability to earnings disappointments or shifts in sentiment.
In such an environment, better diversification can be achieved by increasing exposure to indices with lower AI concentration or different sector compositions altogether. Spreading allocations across various themes, countries, and less-concentrated markets can be another option that helps reduce reliance on a few dominant stocks.
Beyond equity allocations, diversification also extends outside equities altogether. Gold and various other precious metals are often used as a portfolio hedge during periods of elevated uncertainty, such as 2025 and 2026, offering protection against equity risks, valuation compression, and even shifts in liquidity or real interest rate expectations.