Global investors often view Europe through a narrow lens of slow growth, complex politics, and periodic crises. Yet the region remains home to some of the world’s most influential companies across luxury goods, pharmaceuticals, industrial technology, banking, and advanced manufacturing. Many European firms generate a significant share of their revenues globally, making the region’s equity markets deeply connected to international trade and economic cycles.
Europe’s openness also means that global shocks are often felt quickly across its economies and markets. As geopolitical tensions rise and energy markets turn volatile again, the environment carries a familiar undertone for Europe. With global oil flows passing through the Strait of Hormuz, the situation evokes a sense of déjà vu for Europe after the energy shock triggered by the Russia–Ukraine War.
| Country | Key Takeaways |
|---|---|
| UK | The UK economy grew modestly (~1.3% in 2025), while its FTSE 100 index remains heavily weighted toward financials, energy, and consumer staples, supporting relatively high dividend yields of around 3.5%. |
| France | France’s GDP growth remains moderate (~1%), supported by consumption and exports. The CAC-40 is heavily weighted toward consumer discretionary (~34%) and industrials, reflecting strengths in luxury goods, aerospace, and defence. |
| Germany | German GDP growth remains low (~0.3%) amid weak manufacturing and soft global trade. The DAX-40 index, dominated by industrial and export-oriented firms, remains closely tied to global manufacturing and external demand cycles. |
| Switzerland | The Swiss economy remains stable, with GDP growth of ~1.4% and low inflation (~0.2%). The SMI is concentrated in healthcare (~36%), reflecting the country’s global leadership in pharmaceuticals and defensive, export-oriented sectors. |
| The Netherlands | The Dutch economy is highly open, with exports equivalent to ~85% of GDP. The AEX index has substantial technology exposure (~31%), making both economic growth and equity performance sensitive to the global semiconductor and trade cycles. |
| The Broader European Market | For investors, Europe presents a combination of global sector exposure, attractive dividend income, lower valuations and cyclical sensitivity to the broader global economy. |
Macroeconomic Trends Across Europe’s Leading Economies
The UK, Germany, France, the Netherlands, and Switzerland together account for around two-thirds of Europe’s GDP, making them central to the region’s growth dynamics and equity market performance.
Economic developments in these economies provide important signals about broader European trends. The inflation shock following the Russia–Ukraine War in 2022 highlighted how differently countries across Europe respond to external disruptions.
As energy and food supply chains were disrupted, inflation surged across the region. Energy-dependent economies saw sharper spikes, with inflation reaching 11.6% in the Netherlands and 8.7% in Germany, while France (5.9%) and Switzerland (2.8%) remained relatively insulated due to their greater reliance on nuclear and hydroelectric power, respectively.
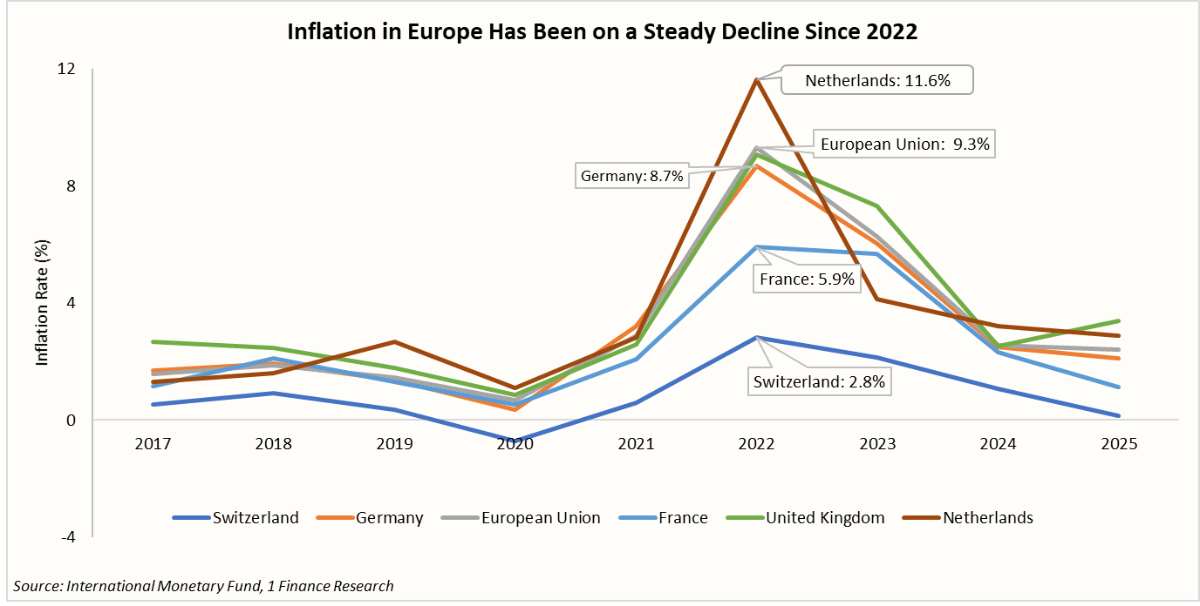
Inflation across Europe gradually eased between 2023 and 2025, moving closer to the 2% target as energy prices stabilised and supply conditions improved.
The region also accelerated investments in renewables, LNG import capacity, and alternative gas suppliers, reducing dependence on Russian energy, while tighter monetary policy helped anchor inflation expectations.
We summarise the economic performance, key growth drivers for 2025, as well as the Economic outlook and risks across these economies for 2026 in the table below.
| Country | 2025 Economic Performance and Drivers of Growth | 2026 Outlook & Risks |
|---|---|---|
Germany |
|
|
United Kingdom |
|
|
Switzerland |
|
|
France |
|
|
Netherlands |
|
|


Recommended for you
Readers also explored

India's IT Sector Outlook for FY2026

Currency in Circulation: How Much Money Exists in the World?
Macroeconomic conditions also shape equity market performance through their influence on corporate earnings, liquidity, and interest rates, which in turn affect investor sentiment and the equity market returns. The equity markets in these countries have therefore evolved alongside global economic cycles, energy shocks, and shifts in monetary policy.
Alongside country indices, we also consider a broad pan-European index, STOXX Europe-600. The index includes companies from these countries, with the UK (~23%), France (~15%), Germany (~14%), and Switzerland (~14%), accounting for nearly two-thirds of its composition.
Annual Performance of Major European Equity Markets (2015–2025)
| Year | Europe (STOXX Europe 600 Index) | UK (FTSE-100) | France (CAC-40) | Switzerland (SMI Index) | Germany (DAX 40) | Netherlands (AEX Index) |
|---|---|---|---|---|---|---|
| 2015 | 6.8% | -4.9% | 8.5% | -1.8% | 9.6% | 4.1% |
| 2016 | -1.2% | 14.4% | 4.9% | -6.8% | 6.9% | 9.4% |
| 2017 | 7.7% | 7.6% | 9.3% | 14.1% | 12.5% | 12.7% |
| 2018 | -13.2% | -12.5% | -11.0% | -10.2% | -18.3% | -10.4% |
| 2019 | 23.2% | 12.1% | 26.4% | 26.0% | 25.5% | 23.9% |
| 2020 | -4.0% | -14.3% | -7.1% | 0.8% | 3.5% | 3.3% |
| 2021 | 22.2% | 14.3% | 28.9% | 20.3% | 15.8% | 27.7% |
| 2022 | -12.9% | 0.9% | -9.5% | -16.7% | -12.3% | -13.7% |
| 2023 | 12.7% | 3.8% | 16.5% | 3.8% | 20.3% | 14.2% |
| 2024 | 6.0% | 5.7% | -2.2% | 4.2% | 18.8% | 11.7% |
| 2025 | 16.0% | 21.5% | 10.4% | 14.4% | 23.0% | 8.3% |
Index Returns are represented in local currency units. Currency: EUR for Germany, France and the Netherlands, GBP for the UK and CHF for Switzerland.
Over the past decade, Germany (DAX-40) and France (CAC-40) have led European market returns, with the strongest gains in years such as 2019, 2023 and 2025.
The Netherlands (AEX) has also delivered solid performances during global growth phases in 2019 and 2021. On the other hand, the UK (FTSE 100) has been relatively steadier, performing better in weaker market environments such as 2016, 2022 and 2025.
Higher dividend yields are yet another key feature across European markets. Among these, the FTSE-100 has remained a consistent leader in dividend payouts, offering dividend payouts of around 3.5% annually, supported by its sector mix of energy, mining, and financial companies.
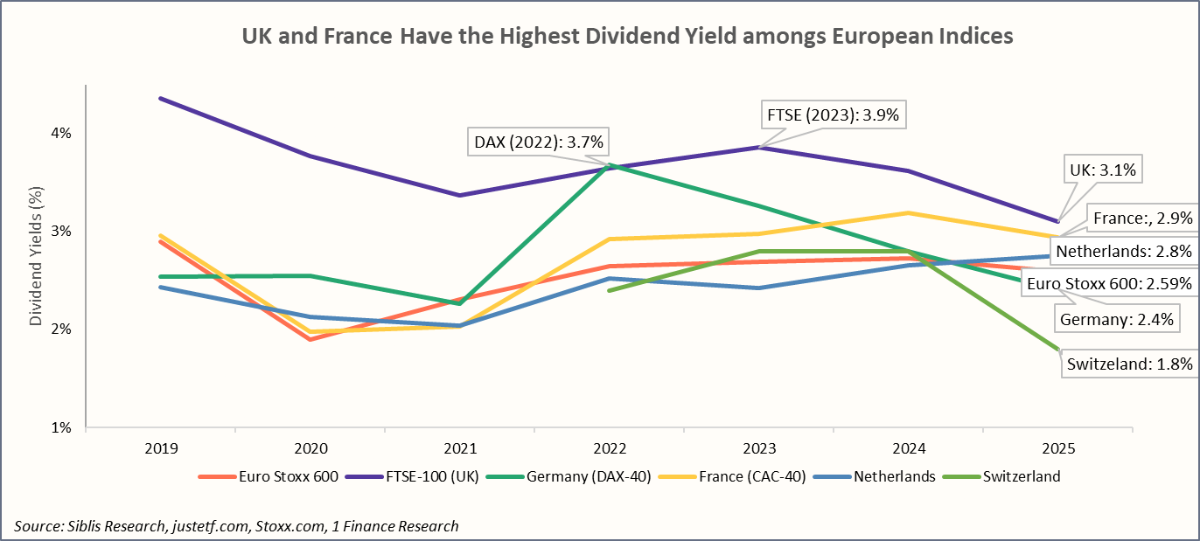
Other markets such as France (2.9%) and the Netherlands (2.8%) have also reported relatively strong dividend yields, supported by steady payouts from large global companies across sectors.
The sectoral composition of indices also reflects the economic strengths of each country. For instance, the UK’s FTSE-100 has strong exposure to financials (23%), energy (14%), and consumer staples (17%), reflecting its dominance in global banks and commodity companies.
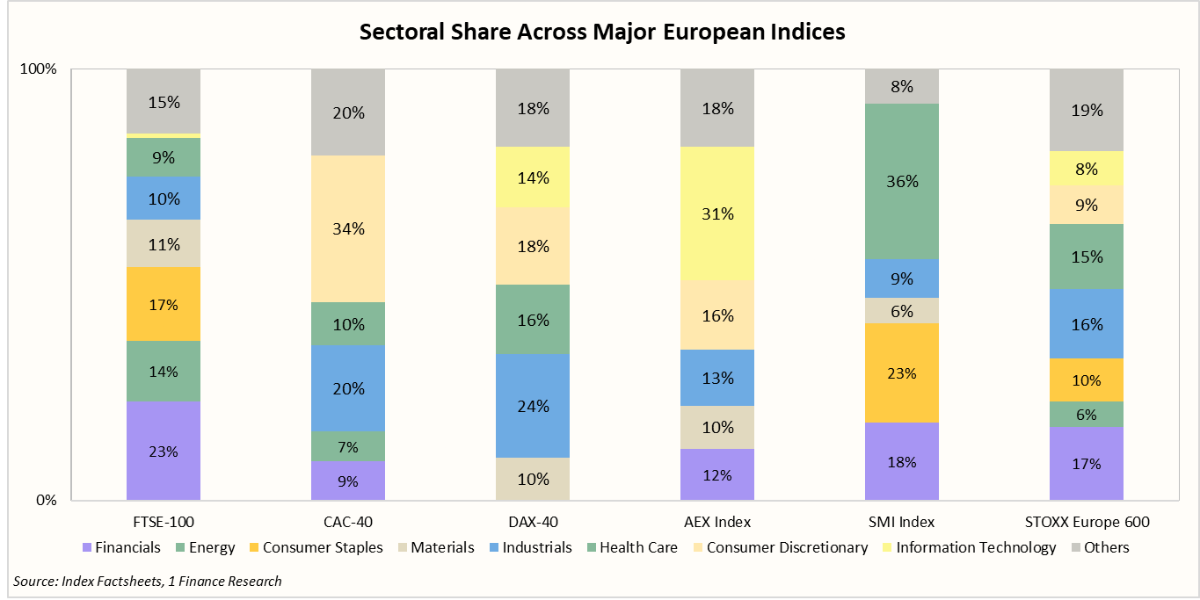
Similarly, France’s CAC-40 and Germany’s DAX-40 have significant exposure to consumer discretionary (~34%) and industrial sectors (~24%), respectively. The Netherlands’ AEX has a higher technology weight (~31%), linked to the country’s role in the global semiconductor supply chain, while Switzerland’s SMI is heavily concentrated in healthcare (~36%), driven by large pharmaceutical companies.
What This Means for Investors
European equity markets provide diversified exposure to globally competitive sectors, including industrials (Germany), luxury goods (France), healthcare (Switzerland), and financial services (UK). Many of these firms generate a substantial share of revenues internationally, linking European market performance closely to global economic cycles.
The region stands out for its strong dividend profile, with the FTSE-100 offering yields of ~3.5%, while France (~2.9%) and the Netherlands (~2.8%) also provide steady payouts from large multinational companies.
However, European markets remain sensitive to energy price volatility and global trade cycles, which can influence both economic growth and equity market performance.
For investors, Europe presents a combination of global sector exposure, attractive dividend income, lower valuations and cyclical sensitivity to the broader global economy.