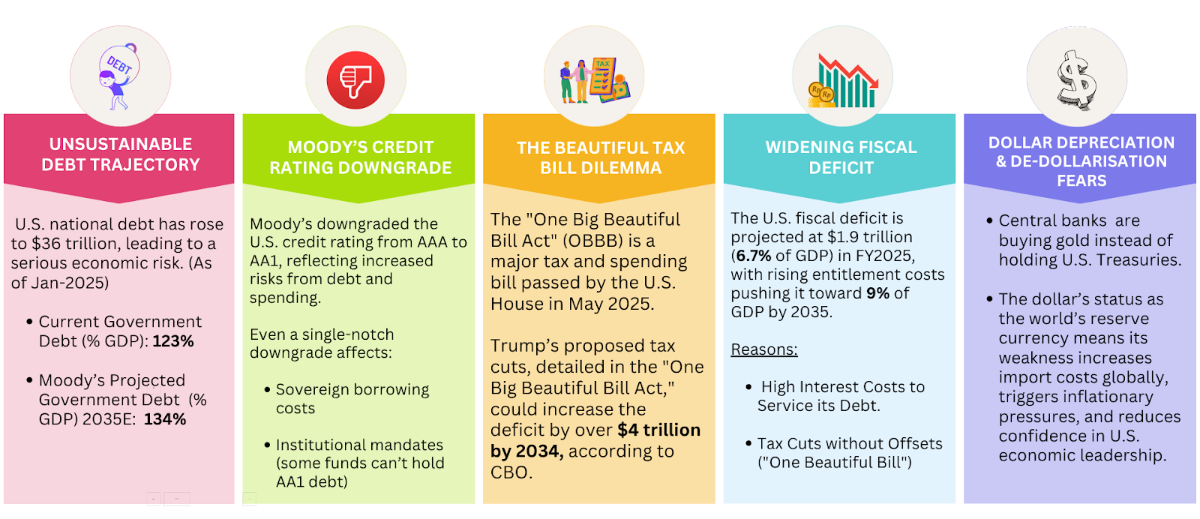
Confidence in the world's largest economy is shaking. Moody’s recent downgrade of U.S. debt to AA1 reflects rising concerns over the country’s $36 trillion debt burden. With persistent inflation and recession fears, expectations for multiple Fed rate cuts in 2025 have scaled back. Meanwhile, politically popular yet fiscally risky proposals like the “One Big Beautiful Bill” further challenge the U.S. fiscal outlook.
This edition will dive deep into these critical issues, asking the questions that matter most:
- What key U.S. macro signals reveal about the economy
- How rating agencies and markets are reacting
- Implications for India and global investors
- What Ray Dalio’s debt cycle tells us about what comes next
Key Threats Impacting U.S. Economic Outlook
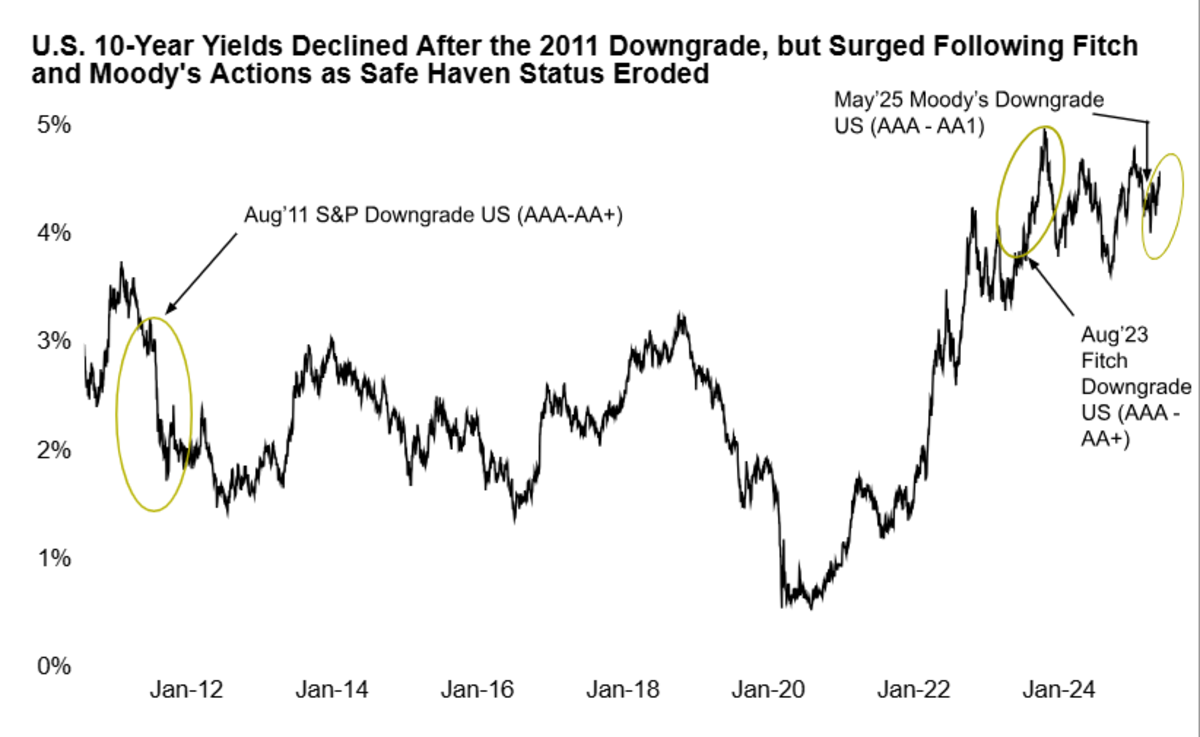
Rising Yields and the Decline of America’s Safe-Haven Appeal
Is the U.S. safe haven status eroding? The chart below illustrates that 10-year yields declined following the 2011 S&P downgrade. However, this time around, recent downgrades by Fitch and Moody's have driven yields up, reflecting deep concerns over U.S. debt and eroding safe-haven status.
Recommended for you
Readers also explored

A Mid-Year Check: Whether India is in Flux

Currency in Circulation: How Much Money Exists in the World?
A Comparative Analysis of Key Economies
A closer look at the fiscal positions of key global economies reveals varying debt burdens and revenue capacities that will shape their economic trajectories in the coming years.
| Country | Central Government Debt (% GDP) | Central Government Debt (% GDP) 2030E | Central Government Revenue (% GDP) |
| U.S. | 123% | 128% | 31% |
| China | 96% | 116% | 25% |
| Germany | 65% | 75% | 47% |
| India | 80% | 75% | 21% |
| Japan | 235% | 231% | 37% |
Foreign Holdings of U.S. Treasuries ($ Billion)
The U.S. Treasury market faces stress from declining foreign demand and rising yields.
| Year | China | Japan |
| March 2021 | $1,100 bn | $1,240 bn |
| March 2025 | $765 bn | $1,130 bn |
A Look at U.S. Equity & Fixed Income Markets
With so many uncertainties in the U.S. macroeconomic situation, it’s crucial to stay informed about key market indicators. The chart below tracks two essential metrics for the S&P 500:
- Shiller's CAPE Ratio
- Shiller's Excess CAPE Yield (ECY)
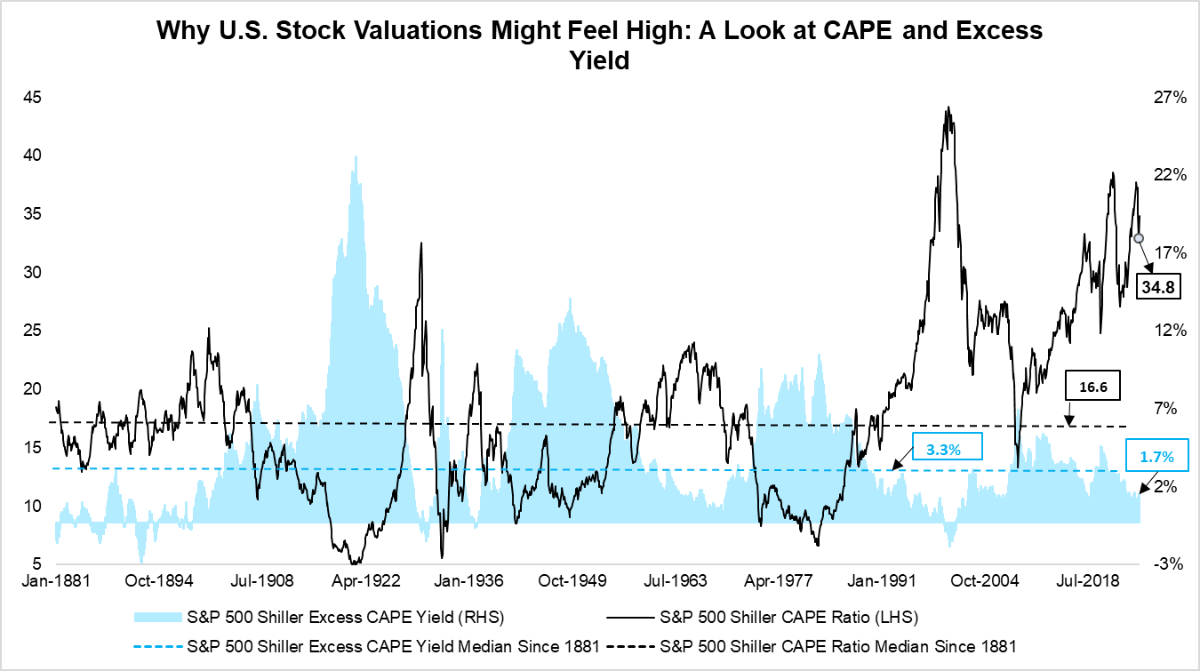
| Metric | What it Measures | What a High/Low Value Means | Current (May 2025) | Long-term median since 1881 |
| CAPE Ratio | Valuation of Equity Market (adjusted for earnings cycles). | High → Overvalued Market | 34.8 | 16.6 |
| Excess CAPE Yield (ECY) | Real excess return of stocks relative to government bonds | Low → Equities are less attractive vs. bonds | 1.7% | 3.3% |
U.S. equities appear significantly overvalued, with CAPE at 34.8 vs. a 16.6 median, and a low Excess CAPE Yield of 1.7%.
What Could the U.S. Economic Situation Mean for India?
1] Capital inflows could strengthen in:
- Indian equities (especially large-caps)
- Government bonds (if the rupee stabilises)
2] India’s macros look more stable in comparison, due to:
- Continued government capital expenditure
- Favourable outlook on inflation
- Pickup in retail consumption
- Easing financial conditions
What Ray Dalio Taught Us: Interest Rates, Money Printing & Recession Signals
Ray Dalio, founder of Bridgewater and the man who predicted the 2008 crisis, revealed his secret in the book ‘How Countries Go Broke’. His core insight? Debt builds in cycles, and when it becomes too large to manage with normal interest rates, central banks are forced to print money.
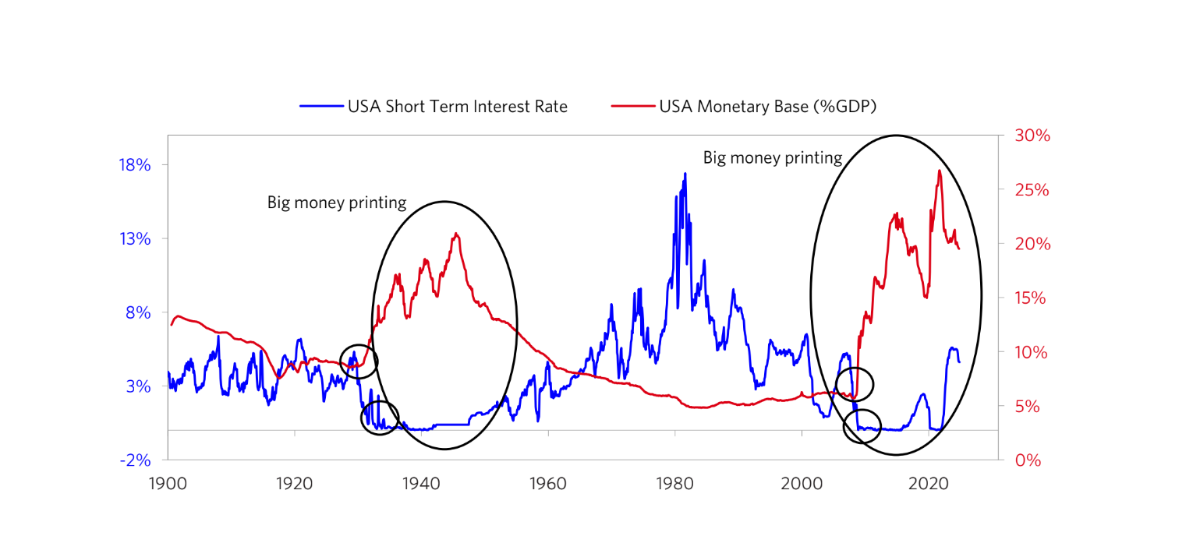
From 1980 to 2008, rate cuts kept the system going. But when rates hit zero, just like in 1933, the Fed began massive money printing. Dalio calls this the turning point in the Big Debt Cycle.
Why it matters today:
With U.S. debt and interest costs soaring, Dalio’s framework warns of a potential repeat. Rapidly rising interest rates could accelerate economic strain. Investors can better anticipate and prepare by diversifying into real assets like gold or real estate and exploring fiscally sound markets.
Our Outlook on the U.S. Market
| Key Factor | Current Scenario | Impact on U.S. Markets |
| Government Debt & Credit Rating | $36 trillion debt; Moody’s downgrade to AA1. | Credit downgrades suggest rising sovereign risk, raising Treasury yields, borrowing costs, and slowing GDP. |
| Foreign Demand for Treasuries | Major holders (China, Japan) are reducing exposure. | Lower foreign demand pushes yields up. This weakens bond prices, amplifies refinancing burden, and puts downward pressure on the dollar over time. |
| Fiscal Policy Outlook | Large deficit proposals (e.g. “Beautiful Bill”) without matching revenues. | Rising deficits without revenue cover boost inflation expectations, especially if financed by debt. This increases yields and may reduce investor confidence in fiscal sustainability. |
| Equity Valuations (CAPE & ECY) | CAPE at 34.8 (high); ECY low at 1.7%. | High valuations with low ECY suggest equities are vulnerable to earnings disappointments or yield shocks. |
| Tariffs & De-dollarisation | U.S. tariff actions against the EU, China, and emerging nations. | U.S. tariff wars disrupt global trade, weaken trust in the dollar, and speed up de-dollarisation as nations shift to local currencies. |
The U.S. faces rising fiscal stress—$36 trillion in debt, credit downgrades, and declining foreign appetite for Treasuries. Add to that high equity valuations and shrinking risk premiums, and the market outlook turns cautious.
As fiscal proposals like the "Beautiful Bill" push deficits higher, concerns about sustainability grow. For global investors, this may shift flows toward more stable markets like India, where macro fundamentals appear stronger.
The road ahead demands a sharp focus on global signals and smart diversification.


