As global macro conditions evolve, Indian debt markets are experiencing notable shifts. From yield spreads tightening to FPI flows reversing, several key trends are shaping the debt outlook this month.
Here are five charts and insights that tell the story of India’s debt market in May 2025.
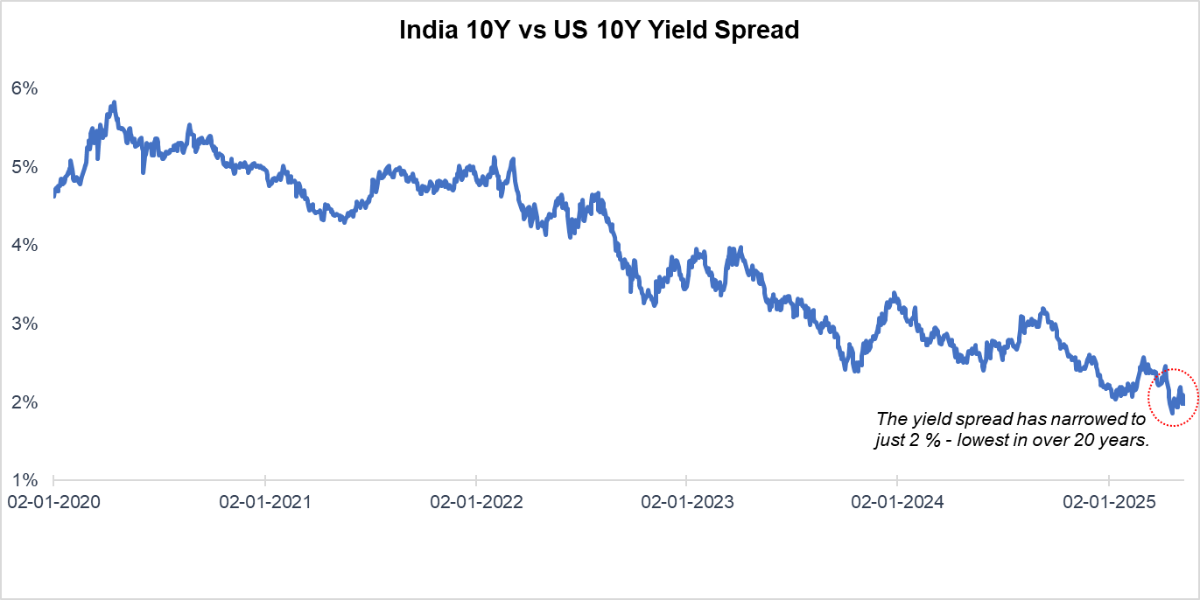
1. Yield Spread at Multi-decade Lows
On April 11, 2025, the U.S. 10-year Treasury yield touched a short-term high of 4.49%, while India’s corresponding yield fell to 6.44%, compressing the spread to below 200 basis points. Since then, the spread has stabilised in the 2.00%–2.29% range—a level not seen in decades.
Persistent U.S. inflation, delays in anticipated Fed rate cuts, and elevated market volatility have increased U.S yields, undermining the relative attractiveness of Indian debt for foreign investors.
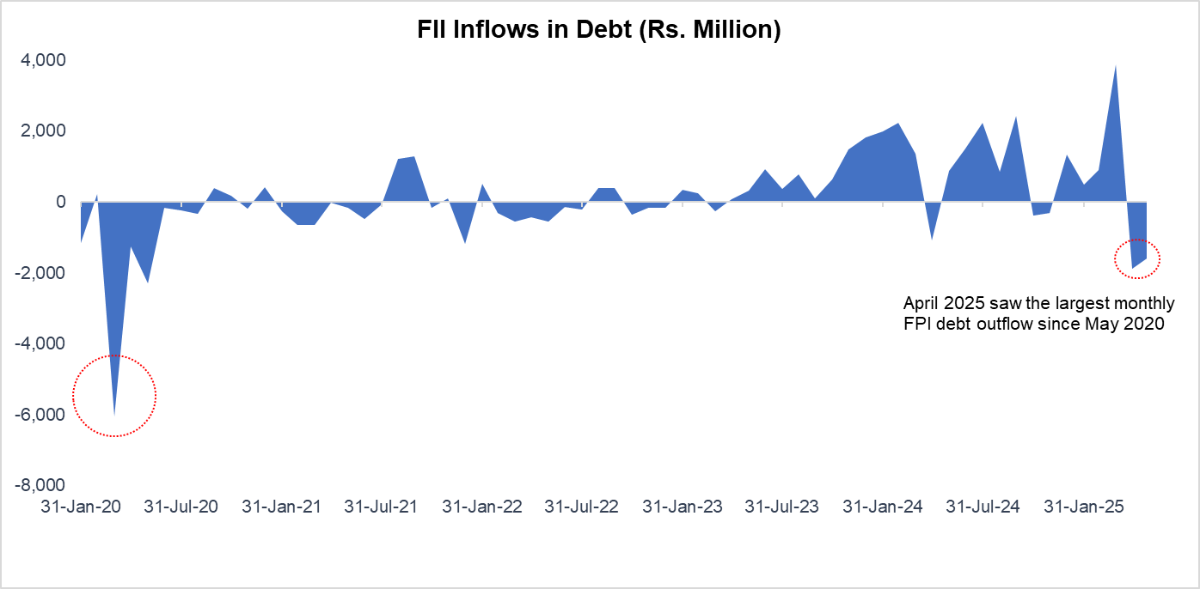
2. FPI Flows Reverse as Relative Attractiveness Shifts
April 2025 saw $2.27 billion in FPI outflows from Indian debt—the largest monthly outflow since May 2020. This ended a streak of four consecutive months of inflows and marked the first net outflow since November 2024. The trend is primarily attributed to:
- Narrowing yield premium
- Rupee depreciation
- Rising U.S. yields
Recommended for you
Readers also explored

Falling CPI Inflation: What It Means for Interest Rates, Markets, and Households

India's IT Sector Outlook for FY2026
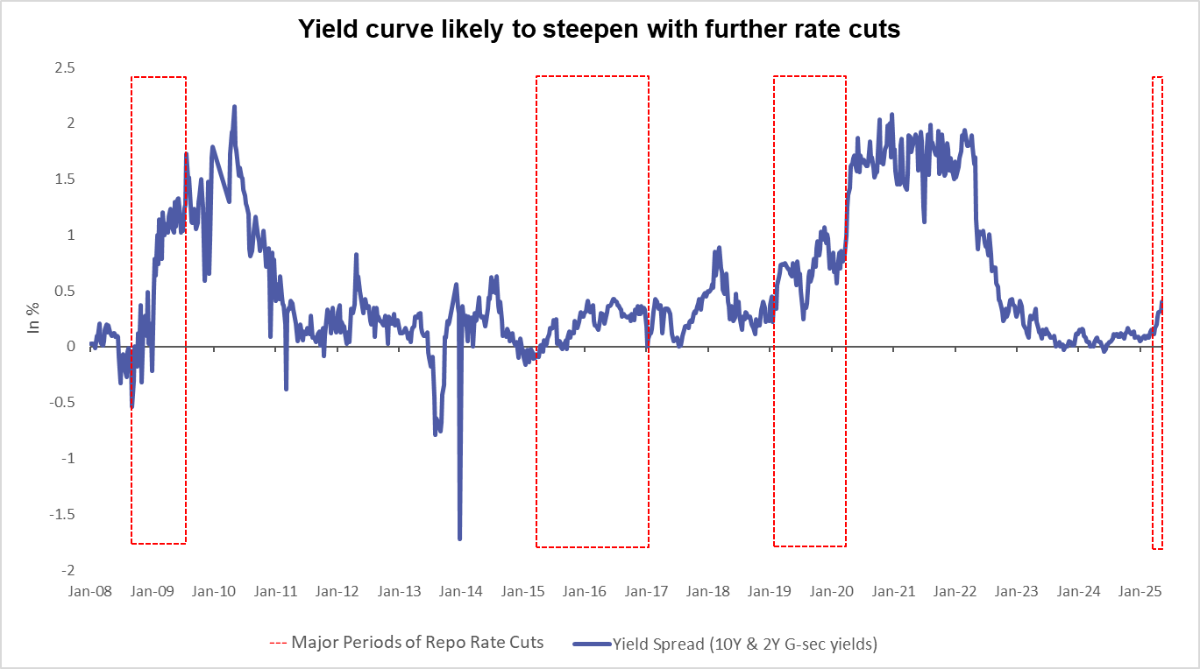
3. Yield Curve Set to Steepen as Rate Cuts Begin
The RBI’s gradual and shallow rate cut cycle in FY26 (expected total cut: 50–75 bps) is expected to result in:
- Short-term yields (under 3 years) are falling more rapidly
- Long-term yields remain relatively sticky
- After a period of flattening, the yield curve is poised to steepen modestly.
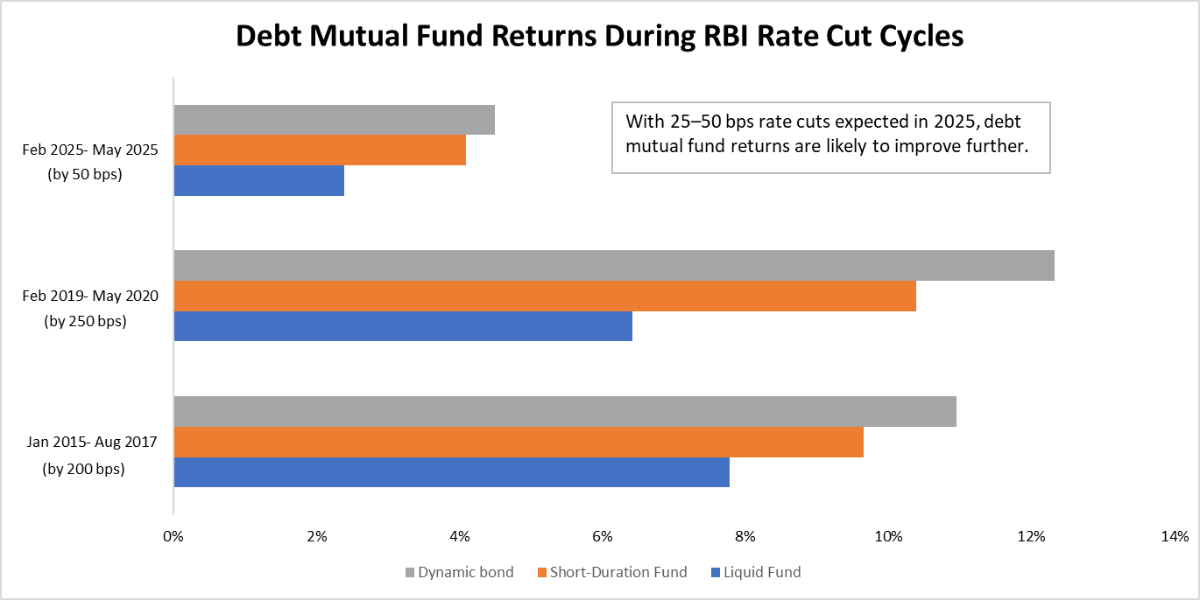
4. Historical Performance of Debt Mutual Funds: Opportunities amid easing rates
Debt mutual funds, especially in the dynamic bond and short-duration categories, have historically delivered superior risk-adjusted returns during easing cycles.
5. Our Outlook for May 2025
| Key Factor | Current Scenario (May 2025) | Yield Curve Impact |
| Global Market | -US yields soften further to 4.2%, easing dollar strength. | ⬇ Long-end |
| Inflation (CPI) | Eased to 3.16% in April, driven by food price correction | ⬇ Short-end |
| GDP Growth | RBI: 6.5%, IMI: 6.8%; private capex improving but still slow | ↔ Long-end |
| Liquidity | Systemic liquidity turned surplus (~₹6 lakh cr) after the RBI dividend and OMOs | ⬇ Short-end |
| Monetary Policy | RBI reduced repo rate to 6% and changed to an accommodative stance. | ⬇ Short-end |
| Currency and Flows | INR stable; FPI debt inflows | ⬇ Long-end |
The macro backdrop continues to put downward pressure on yields. With inflation cooling and the RBI turning accommodative, short-end yields are expected to fall more rapidly than long-end ones, leading to a steepening of the yield curve.
With most tailwinds aligning—U.S. yield moderation, contained CPI, stable INR, and improved liquidity—Indian debt markets are well-positioned. We expect further RBI rate cuts of 50–75 bps in FY26, which could reinforce the downward trend in yields, particularly at the short end of the curve.