Introduction
Being the world’s most populous country, it comes as no surprise that India’s GDP is largely driven by consumption, especially household spending (~60% of GDP), and no lens reflects that everyday spending better than the FMCG sector. In this blog, we take a macro-first view of the factors shaping the Indian FMCG Sector in 2026, and what they mean for both growth and margins.
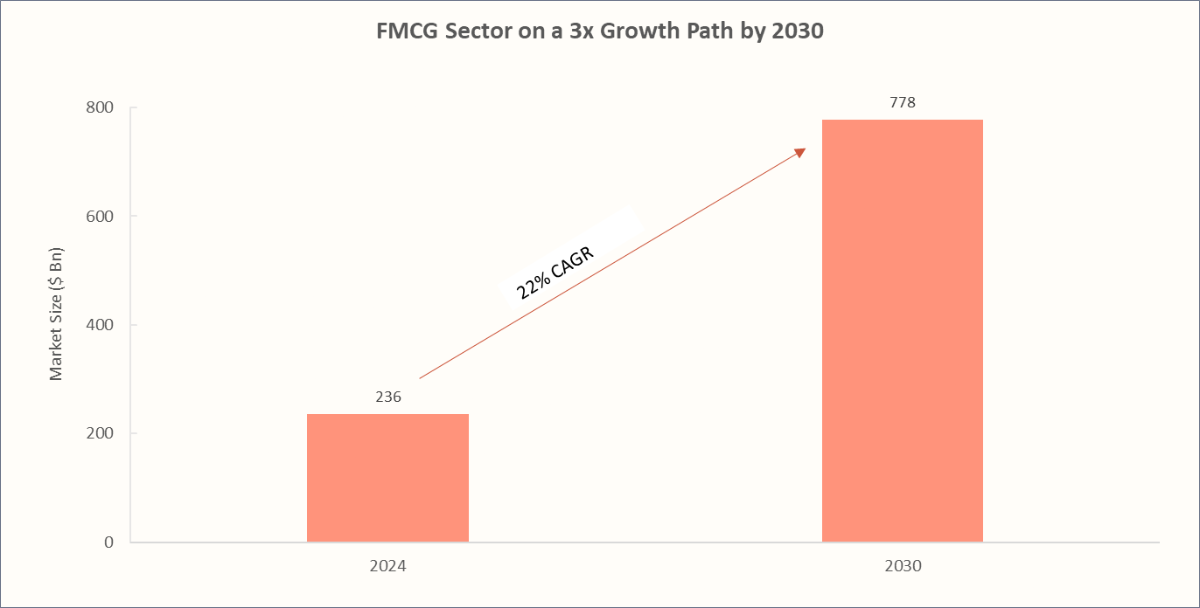
FMCG, i.e., Fast Moving Consumer Goods, refers to affordable everyday products that sell quickly and have a short shelf life. The FMCG sector is the 4th largest in India, contributing ~3% to GDP and providing jobs to nearly 3 million people. CRISIL projects the Indian FMCG sector to grow 6–8% by revenue in FY2026, as compared to a more modest 5-6% expected in FY2025, driven by urban demand recovery, steady rural demand, and stable credit profiles.
Financial Performance of NIFTY FMCG Companies
FMCG Sector Stocks in India:
| Company | NIFTY FMCG Weightage | Industry P/E | P/E | P/B | Earnings Yield % | Sales Growth 10Yrs % |
|---|---|---|---|---|---|---|
| Personal & Household Care | ||||||
| Hindustan Unilever | 26% | 47.2 | 58.6 | 12.6 | 2.3 | 7 |
| ITC | 21% | 25.1 | 7.1 | 5.4 | 6.9 | |
| Godrej Consumer | 5% | 67.3 | 10.6 | 2.3 | 5.7 | |
| Marico | 4% | 55.3 | 23.2 | 2.4 | 6.6 | |
| Dabur India | 4% | 51.2 | 8.4 | 2.6 | 4.9 | |
| Colgate-Palmoliv | 3% | 44.1 | 37 | 3.1 | 4.3 | |
| Emami | 1% | 30.3 | 9.2 | 3.7 | 6.3 | |
| Packaged Foods & Beverages | ||||||
| Nestle India | 9% | 42.8 | 74.5 | 54.5 | 1.9 | 7.4 |
| Britannia Industries | 6% | 62.8 | 31.6 | 2.2 | 8.6 | |
| Tata Consumer | 4% | 79.9 | 5.2 | 1.9 | 8.2 | |
| Patanjali Foods | 3% | 52.7 | 5.6 | 2.6 | 1.9 | |
| Alcoholic Beverages | ||||||
| United Spirits | 4% | 33.7 | 59.5 | 11.5 | 2.4 | 2.7 |
| United Breweries | 2% | 105.3 | 11.3 | 1.4 | 6.6 | |
| Radico Khaitan | 2% | 93.3 | 14.1 | 1.6 | 13.2 | |
| Non-Alcoholic Beverages | ||||||
| Varun Beverages | 7% | 87.3 | 58.9 | 9.2 | 2.4 | 23.1 |
Recommended for you
Readers also explored

Can Families Outrun Education Inflation in India?

World GDP Breakdown 2025: Who Powers the Global Economy?
Key Financial Insights:
Higher Price-to-Earnings Ratio (P/E): FMCG stocks tend to trade at high P/E ratios, and there’s a good reason for that. Many of these companies benefit from strong brand loyalty and steady demand, but what really stands out is their defensive play during economic downturns, consistent earnings growth, and the assurance of a ready market for essential products. This makes them especially attractive to investors looking for stability even when broader markets turn volatile.
Steady Sales Growth Over the Years: Even though FMCG is a mature sector, it keeps growing at a healthy pace. What’s driving this? Urbanisation, rising e-commerce adoption, and deeper penetration into rural markets. Plus, the shift towards healthier foods, premium personal care, and hygiene products has given the bigger players a solid boost.
Why FMCG Stocks Have High P/B Ratios: These companies aren’t just selling everyday products—they're building brands, investing in R&D, and expanding into premium product categories. That’s why their Price-to-Book (P/B) ratios tend to be on the higher side. Essentially, they’re not just valued for their assets but also for the power of their brands and future growth potential.
Macroeconomic Factors Impacting FMCG in 2025
🟢Easing Inflation driven by Food
If 2024 was all about inflationary pressures, 2025 is shaping up to be a different story. Inflation in India has been cooling off steadily, dropping from 6.21% in Oct-24 to 1.55% in Jul-25; the lowest year-on-year inflation since Jun-17!
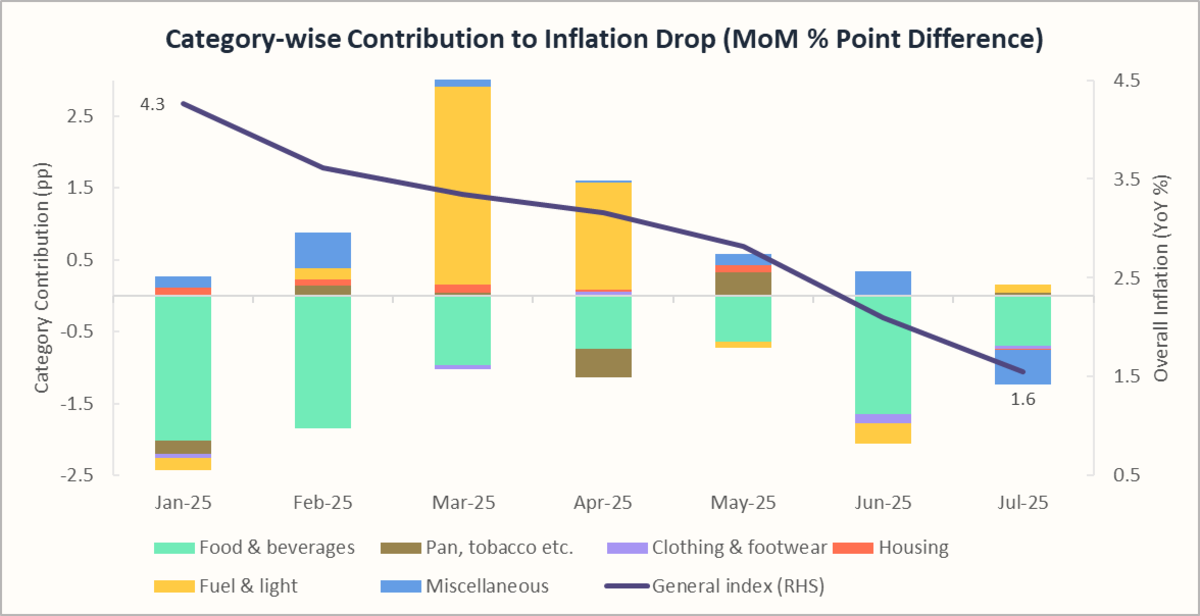
As the chart highlights, the sustained decline in inflation since Jan-25 has been largely driven by food and beverages.
- Vegetable prices fell sharply by 20.7% YoY in Jul-25, supported by a good monsoon and steady supply.
- Pulses (–13.8%), along with spices (–3.1%) and eggs, fish & meat (–0.35%), added further softness, more than offsetting the rise in fruits (+14.4%) and oils & fats (+19.2%).
- A favourable base effect also contributed, as inflation stood at 5.0% in Jun-24, making this year’s reading appear lower in comparison. This trend is part of a broader story of food-led disinflation in India through 2024–25, which we’ve broken down in detail in our blog on why India’s inflation is falling.
🟢RBI Rate cut expected to Boost Consumption
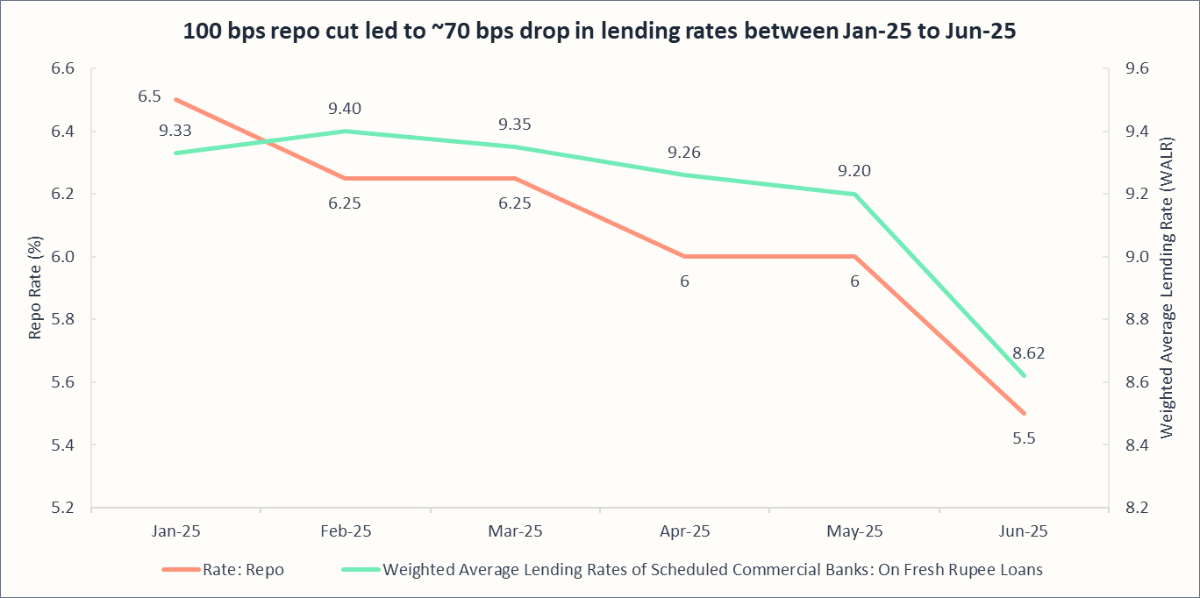
The RBI has cut the repo rate by 100 basis points in 2025, including a surprise 50-basis-point move in June, bringing it down to 5.5%. Why does this matter? Because when rates fall, borrowing gets cheaper across the board.
- For businesses → Lending rates are already down by ~70 bps, freeing up capital to expand capacity
- For households → Lower EMIs mean more disposable income, boosting demand for both staples and discretionary FMCG products in FY2026.
- For FMCG firms → Reduced financing costs ease the working capital burden, enabling faster upgrades in production and distribution.
This easing of rates is just the beginning — and where they head next will be equally important. Our Interest Rate Outlook Index on India Macroindicators tracks these shifts in real time, offering a closer look at the latest trends.
🔴Rupee Depreciation Threatens Import Costs
India imports ~57% of its edible oil needs, making the Indian FMCG sector highly sensitive to currency fluctuations. Vegetable-oil inflation has risen steadily since Oct-2024, reaching 19% YoY in Jul-2025 (vs ~2.5% in Sep-2024). To counter this, the government has launched a $1.2 billion program to double domestic edible-oil production over the next seven years and, in May-25, cut basic customs duty on edible oils from 20% to 10% to reduce landed costs and retail prices. Even so, near-term exposure remains high.
That sensitivity is now being amplified by currency: The rupee slipped by about 3% in 2024 and further ~2% so far in 2025. With sustained capital outflows, a wider current-account gap, and lighter RBI intervention, the bias stays weak, adding cost pressure for import-heavy FMCG categories.
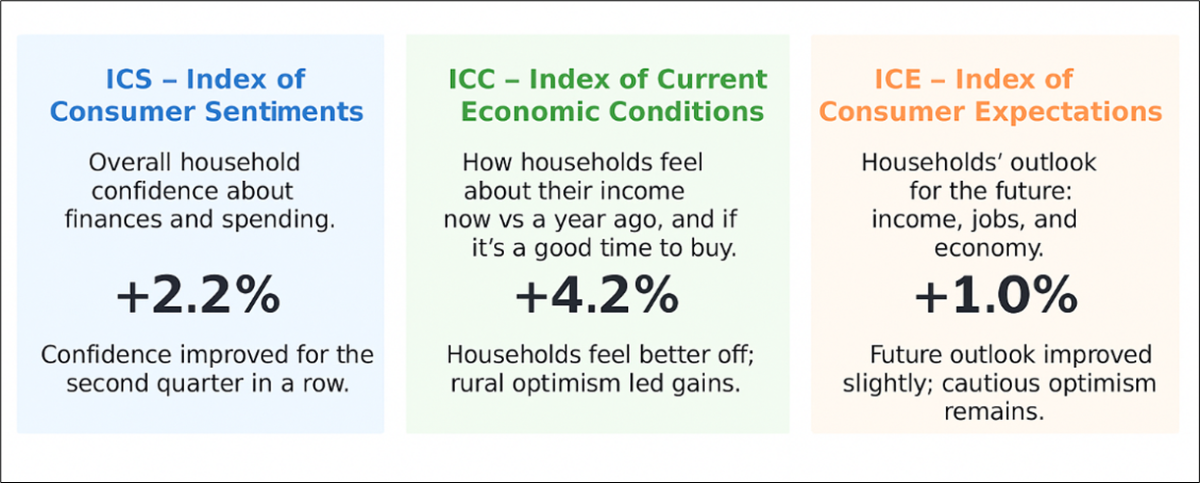
🟢Consumer Sentiment: Turning Upward backed by Policy
Consumer confidence is steadily improving, providing a supportive backdrop for the FMCG sector. In Q2 2025, households grew more optimistic about their incomes and buying power, with rural India leading the uptrend of 4.7% vs 3.2% of urban India. This points to stronger demand for staples and early signs of a revival in discretionary spending.
Here are the numbers backing this trend:
This uptick in consumption is not surprising, given the strategic policy push to enhance household demand:
- Tax-free income raised to ₹12 lakh:
The 2025 Budget extended full tax exemption to individuals earning up to ₹12 lakh annually (₹12.75 lakh after standard deduction), significantly boosting disposable income for middle-class households. - GST structure simplified to two main slabs:
The government is consolidating GST into two primary rates—5% and 18%—by eliminating the 12% and 28% slabs. According to SBI Research, this reform is projected to stimulate consumption by approximately ₹1.98 lakh crore.
Together, these reforms enhance purchasing power and simplify taxation—creating a stronger foundation for consumption. This means the rise in consumer sentiment appears not just cyclical but supported by meaningful, structural policy interventions.
For a deeper dive into India’s inflation journey, see our blog: How Tax Relief and Rate Cuts Will Shape India’s Economy
How FMCG Performed in 2025 so far
The NIFTY FMCG sector has lagged behind both the NIFTY 50 and the Nifty India Consumption Index year to date, reflecting a shift in consumer spending toward discretionary products.
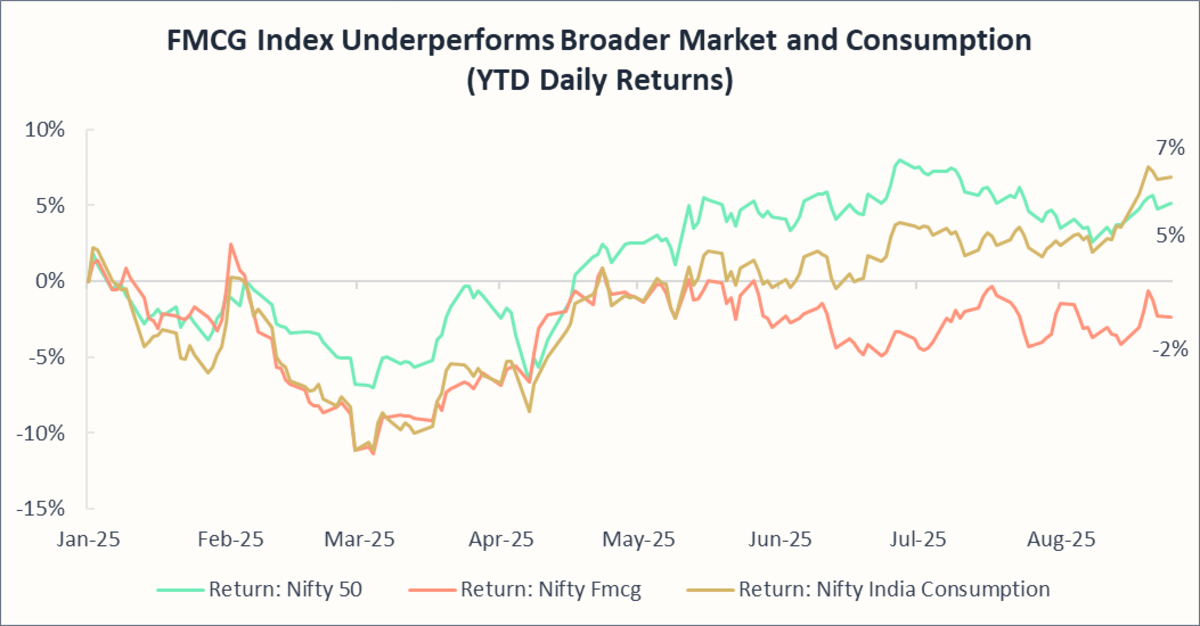
Period: January 1, 2025, to August 25, 2025
Why is FMCG underperforming despite supportive macros?
- Valuations are already high, so even with a good macro setup, there isn’t much room for fresh upside.
- Volumes have not grown as strongly as expected, and urban consumption is still in recovery mode.
- Competition is heating up, as regional brands and D2C players eat into market share and pricing power.
- Investor flows are chasing growth, with money moving toward autos, discretionary consumption, and other high-beta sectors — leaving FMCG on the sidelines.
Price and Volume Growth in FY2025 (Y-o-Y)
Here’s a snapshot of how FMCG pricing and sales volumes changed throughout FY2025:
| Period | Price Growth | Volume Growth | Value Growth | Catalysts |
| Q1 FY2025 | 0.5% | 2.8% | 3.3% | Growth slowed as compared to Q4 FY 2024 (6.7%) because of weak urban consumption and rising food inflation. |
| Q2 FY2025 | 1.8% | 3.5% | 5.3% | Inflationary pressures led to price hikes, while cautious consumer spending resulted in moderate volume growth. |
| Q3 FY2025 | 3.7% | 6.2% | 10.1% | Festive demand, strategic pricing, and easing inflation drove strong volume and price expansion. |
| Q4 FY2025 | 5.6% | 5.0% | 10.9% | Rural demand lifted Home and Personal Care volumes, while Food & Beverages faced input cost pressures and urban markets lagged. |
| Q1 FY2026 | 7.4% | 6.0% | 13.9% | Rural markets grew faster than urban areas for the sixth consecutive quarter, while urban regions continued to rebound, narrowing the growth gap. |
Overall Insight:
Across FY2025, both volume and value growth remained robust, even as inflationary pressures forced periodic price hikes. The sector demonstrated resilience with festive demand, rural consumption, and strategic pricing, keeping momentum strong. By Q1 FY2026, growth was led more by pricing than volumes, reflecting a shift where companies leveraged pricing power while rural demand stayed supportive and urban markets gradually recovered.
Sub-sector Trends
| Sub-Sector | Market Data | Demand Trends | Supply Trends |
| Household & Personal Care | Market Share: 50% Revenue CAGR (10yr): 7% | 1. Growing demand for budget-friendly options: -Nearly 45% of urban consumers are opting for more affordable brands -There is a strong spending intent on cleaning, skincare, and grooming products 2. Premiumisation & conscious buying: - Consumers are willing to pay more for eco-friendly, pet-safe, antibacterial, and biodegradable home care products. | 1. Smaller packs catering to rural consumers: - Brands are offering low-cost, smaller packs (like ~`₹10 sachets for cleaners) to make products more affordable and build brand loyalty. 2. Premiumisation in skincare & home care: - Premium skincare is growing at 12% CAGR, with a focus on anti-aging, hydration, and skin-brightening products. - High-end antibacterial household cleaners are also seeing increased demand. |
| Food & Beverages | Market Share: 31% Revenue CAGR (10yr): 11% | 1. Health-conscious consumers: - 78% of shoppers are willing to pay more for healthier snacks/beverages. - 63% prefer natural products, while 55% opt for organic products 2. Clean label & sustainable foods: - More people are looking for additive-free, minimal ingredient foods. - In 2023 alone, 5,000 clean-label products were launched in India, making up 13% of global share. | 1. Private label expansion: - Private-label food products are 25-40% cheaper than branded items. - They now account for 4% of total retail sales, with a 70% share in food. 2. Local brands winning consumer trust: - 45% of Indian consumers prefer local F&B brands. - Regional flavors, organic, and artisanal products are gaining market share. |
| Healthcare | Market Share: 19% Revenue CAGR (10yr): 12% | 1. Growing trust in Ayurveda & Natural Health: - 36% of Indians believe in Ayurvedic health benefits. - 61% prefer side-effect-free nutraceuticals over traditional medicines, signalling a shift toward natural wellness. 2. Rise of digital & self-diagnosis health trends: - 71% of households used nutraceuticals in the past year; 69% without a doctor’s recommendation. - 56% trust Instagram influencers for health advice; 39% rely on YouTube. | 1. AI & personalised healthcare growth: - Direct-to-Customer (D2C) brands are offering at-home consultations for skincare, stress, and gut health. - GenAI health coaches are providing personalised recommendations, making digital healthcare more accessible. 2. Government push for transparency & AYUSH growth: - FSSAI has now mandated front-of-package (FOP) labeling to assist consumers in making informed food choices. - The government is also promoting traditional medicine, increasing the AYUSH budget by 23.7%, with 46% of rural and 53% of urban consumers embracing Ayurveda |
Investment and Expansion Strategies of FMCG Companies
Boosting Local Manufacturing
To tackle supply chain challenges, FMCG companies are ramping up local production and cutting down on import dependency. Government initiatives like ‘Make in India’ and PLI schemes are further driving domestic manufacturing, making supply chains more resilient.
Omnichannel Expansion
Consumers are shopping both online and offline, and FMCG brands are making sure they stay ahead by integrating both channels smoothly. Hyperlocal deliveries, quick commerce (10-minute delivery), and AI-driven customer insights are becoming key strategies to improve shopping experiences and boost customer retention.
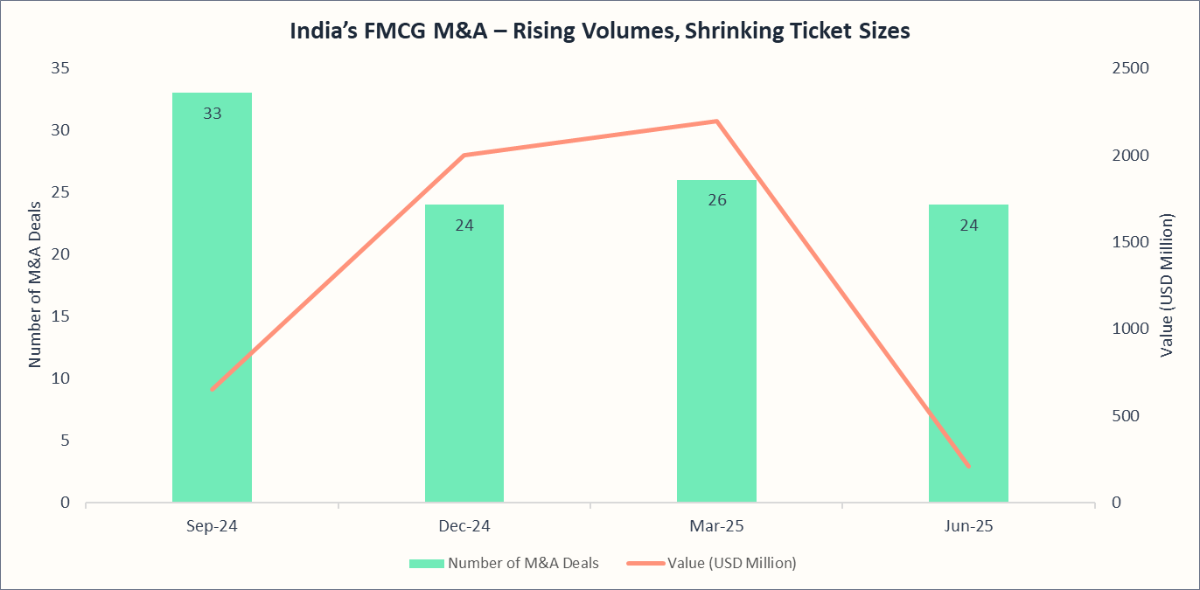
Mergers and Acquisitions (M&A)
Big FMCG players are eyeing strategic partnerships and acquisitions to fuel growth. Emerging D2C brands are a hot target, as FMCG giants look to expand their digital presence and penetrate new markets faster.
What the data shows:
- Comeback in deal-making: Following a slowdown in 2023, India’s FMCG M&A activity revived sharply in Q1 2025, hitting a 3‑year quarterly high, driven by food processing, personal care, and condiments.
- Smaller, shrewder acquisitions: Q1 2026 saw 118 consumer & retail deals worth ~$849 million, reflecting a 78 % fall in deal values, signaling a pivot toward mid‑sized, strategic tuck-ins rather than blockbuster mergers.
Refined strategy in execution: FMCG giants are focusing on acquiring digital-first, premium, and regional niche brands—like HUL’s Minimalist (2025), Tata Consumer’s Capital Foods and Organic India (2024), and Adani Wilmar’s Tops Ketchup maker (2025), leveraging their distribution power to scale these brands nationwide.
Final Thoughts
2024 was a tough year for FMCG, marked by high inflation and uneven consumption. But the setup for 2025–26 looks more supportive. Lower food prices, better rural demand, and tax relief are giving the sector fresh momentum, while RBI’s rate cuts are putting more money in the hands of both households and businesses.
Still, risks can’t be ignored: currency weakness keeps edible oil costs elevated, competition from regional and D2C brands is intensifying, and global commodity volatility could quickly change the cost outlook. Investors, too, may continue to chase higher-growth sectors like autos and discretionary consumption, leaving FMCG as a quieter play.
That said, the strength of FMCG lies not in breakneck growth but in its consistency: it is India’s economic stabiliser. For companies that double down on innovation, digital channels, and resilient supply chains, FY2026 could mark a year of steady, profitable expansion—even if headlines chase flashier stories elsewhere.
Recommended Reads
Looking for more sector insights? Explore these:
1) India’s Banking Sector: FY2025 in Review & What to Expect in FY2026
2) IT Sector Outlook 2026: Flat Earnings, Rising GCCs - What’s Next?
3) India’s Automobile Industry: Trends, Performance, and What Lies Ahead


