Introduction
The global economy is slowing down, and Trump’s tariff moves are shaking up capital flows. As we step into FY2026, India’s financial sector carries its share of challenges but also some clear opportunities. With foreign investors pulling money out of Indian markets and global uncertainty all around, the focus has shifted to how strong we are domestically.
And nowhere is this more evident than in banking, where private banks continue to enjoy premium valuations, while public sector banks are making a surprising comeback. In this blog, we look at the most relevant macroeconomic forces shaping India’s banking sector: FIIs’ shifting stance, PSU credit revival, valuation divergences, etc., and share crisp insights on what they mean for the year ahead.
Indian Banking Sector Snapshot
Structure of the Indian Banking System
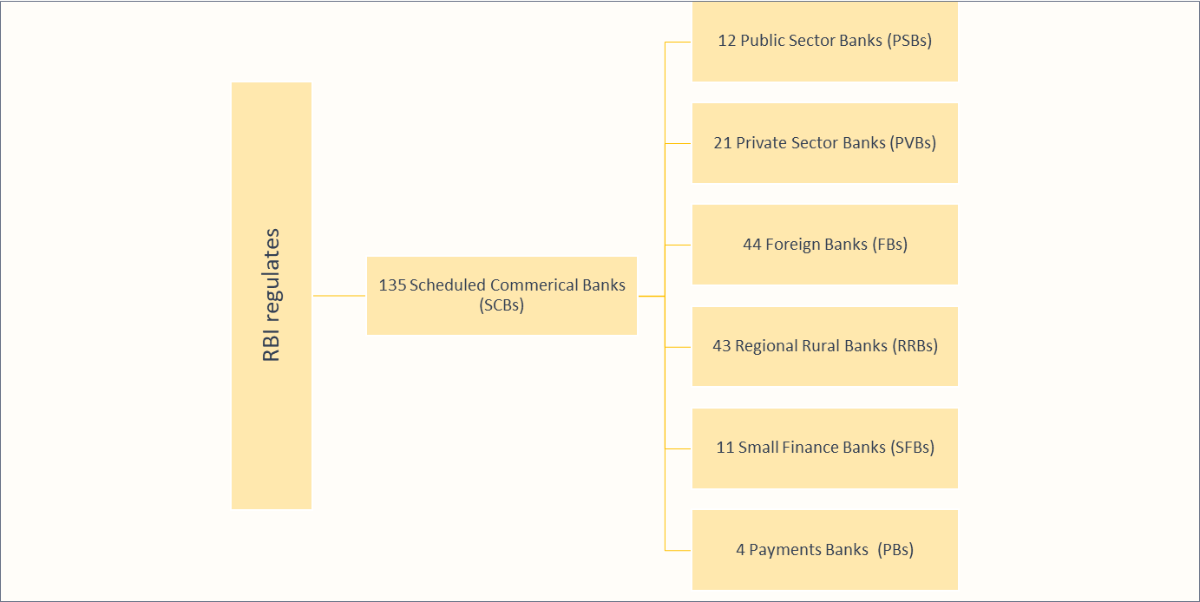
Why are Scheduled Commercial Banks (SCBs) so important?
SCBs sit at the core of India’s financial system and reflect the pulse of the economy. They are the most policy-sensitive institutions since the RBI directly regulates them through multiple instruments, ranging from liquidity and reserve requirements to interest rate operations. Their credit flow has a direct bearing on economic growth, making them central to both monetary transmission and demand creation.
Additionally, SCBs are bound by stringent reporting and capital adequacy norms such as Basel-III, which ensures that their numbers are both transparent and reliable. This combination of regulatory oversight and systemic importance is why most banking sector analysis focuses on SCBs.
India’s banking system has grown at a CAGR of 10.8% in terms of total bank credit in the last decade. Despite steady credit growth, in Q3 FY2025, India had a Credit-to-GDP ratio of 93%- one of the lowest among global peers, as shown below:
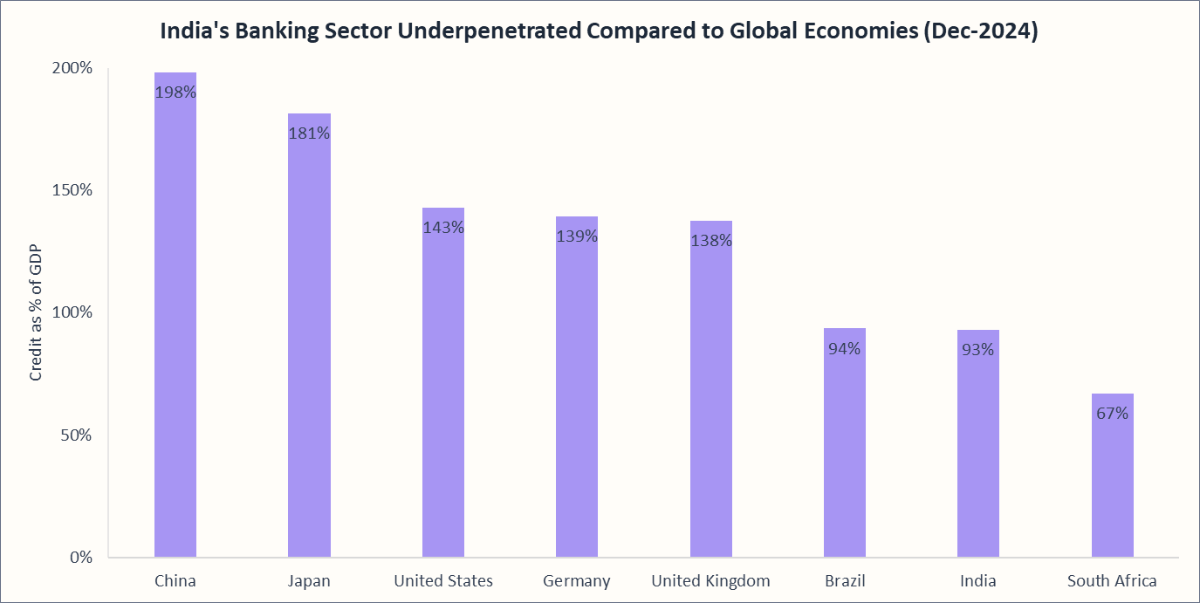
A low Credit-to-GDP ratio indicates underpenetration of financial credit in the country. This also means that the banking sector in India has significant scope for growth in the coming years.
Recommended for you
Readers also explored

How Risks Stack Up in 2026
Nifty 50 Companies List 2025 : Top 50 Stocks in India
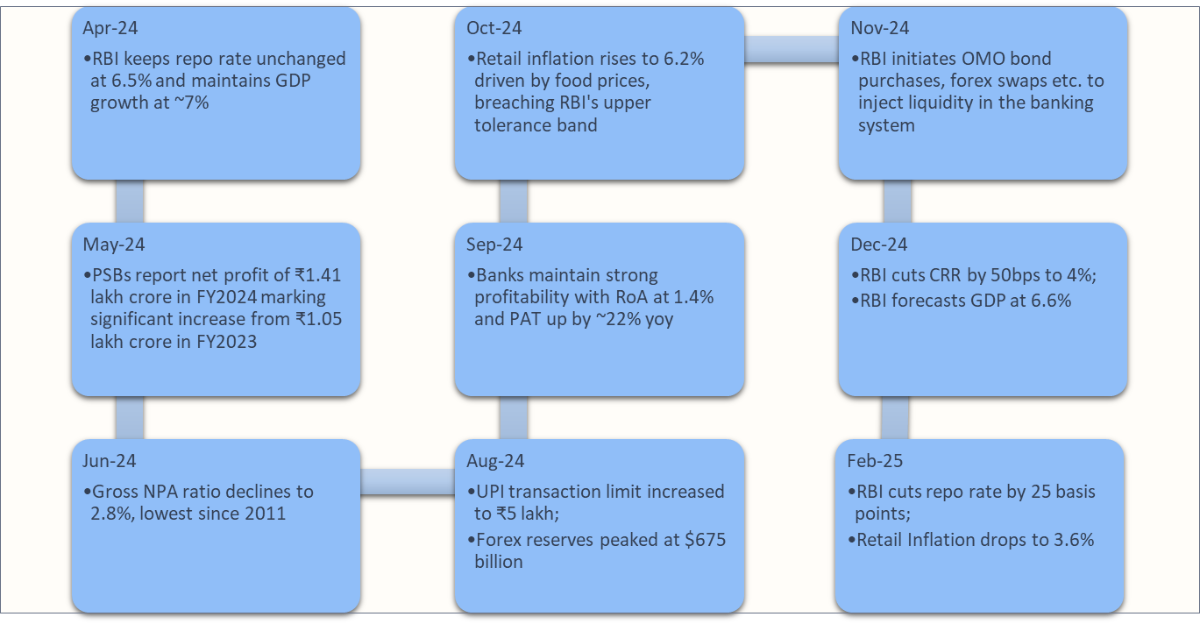
Macroeconomic Environment in FY2025:
- The Indian economy maintained a steady growth momentum, recording real GDP growth of 6.5% in FY2025, making India the fastest-growing major economy in the world.
- In FY2025, inflation trended in two phases—rising from 4.8% in April 2024 to a peak of 6.2% in October, before easing sharply to 3.3% by March 2025, supported by a good monsoon and strong agricultural output.
- Low inflation, supported by a favourable outlook on food and expectations of recovery in GDP growth from the low of Q2 FY2025, contributed to the 25bps repo rate cut to 6.25% in February 2025. Stable inflation and subdued credit growth will drive additional rate cuts in FY2026.
- FY2025 also witnessed strong balance sheets of banks with record-low Non-Performing Assets (NPAs) and decadal high Return on Assets (ROAs), placing banks in a favourable position for growth.
Key Events in the Indian Banking Sector in FY2025
Report- June 2024, Bi-monthly Monetary Policy Statement, 1 Finance Research.
Banking Sector Performance Review
🟢 Divergence in Public and Private Sector Bank Indices
So far, the NIFTY Bank Index has outperformed NIFTY 50, recording a return of 5.4% between January 1, 2025, to August 28, 2025 (YTD), compared to 3.2% for NIFTY 50.
Further, Private Banks closely tracked the NIFTY Bank index, both ending the period with ~5% gains (Private Banks: 4.7%, NIFTY Bank: 5.4%).
This year, we are also seeing recovery in public sector banks (PSUs) due to healthy credit growth and strong balance sheets. In fact, PSU banks overtook private banks in credit growth for the first time in 14 years! This was a result of competitive pricing and expansion in retail credit.
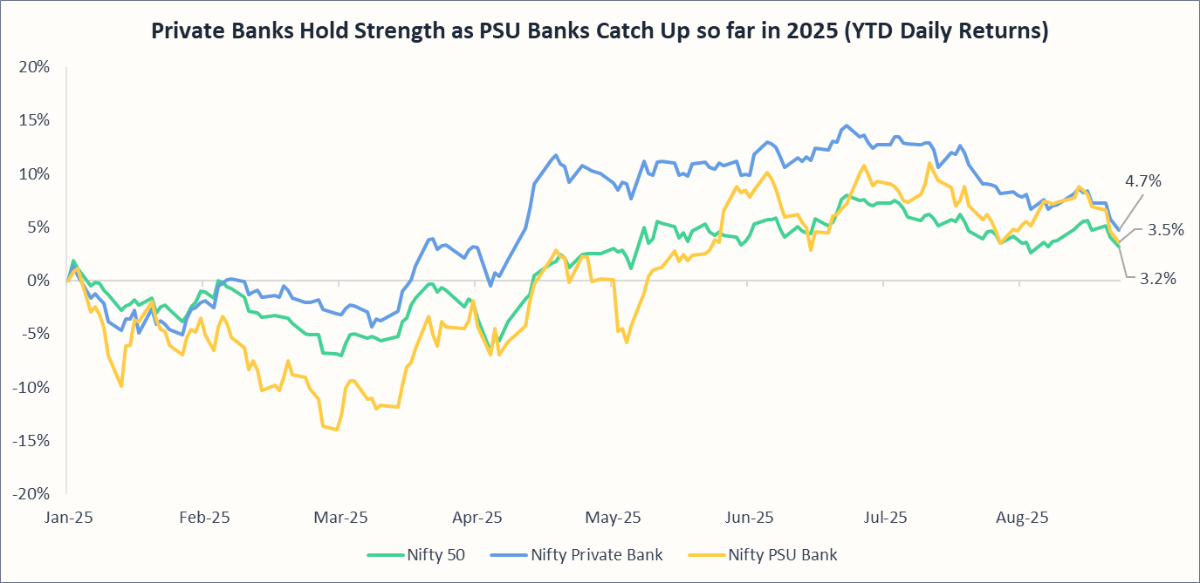
Period: January 1, 2025, to August 28, 2025
🟢 Financial Services Sector stayed strong amid Broad-Based FII Selling
The tale of Trump tariffs that started in February 2025 has culminated in a 50% tariff on Indian exports to the US, making India not only risky but also a weaker market for Foreign Institutional Investors (FIIs)
From September 2024 to August 15, 2025, FIIs withdrew approximately ₹6 lakh crore from various Indian sectors. But not all sectors were hit equally. The chart below highlights the sectors most hit during this period.
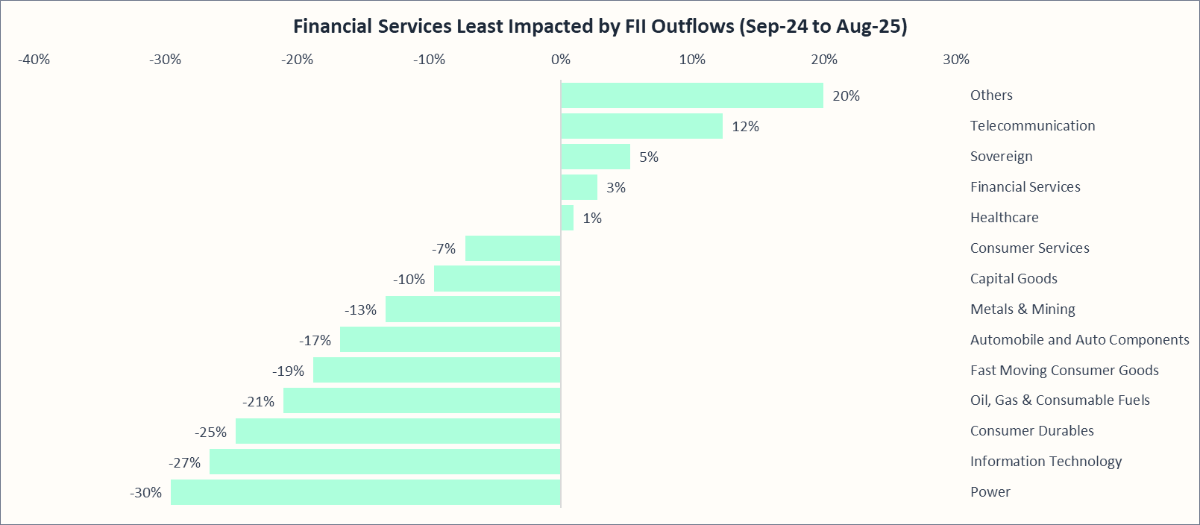
While sectors like Consumer Durables (-25%), Power (-30%), Information Technology (-27%), and Oil & Gas (-21%) bore the brunt of the selloff, Financial Services stood out as an exception, with FII assets under custody rising 3% in August 2025.
This shows a clear shift in the strategy of FIIs, most likely in response to Trump’s tariffs, to focus more on domestic-oriented sectors, which have low sensitivity to global shocks, like the healthcare and financial services sectors.
🟡 Stock Performance of Nifty Bank Companies
| Name | Nifty Bank Weightage | Industry P/E | P/E | P/B | Sales Growth 10Yrs % | Profit Growth 10Yrs % | ROA% | ROE % |
|---|---|---|---|---|---|---|---|---|
| Public Sector Banks (PSUs) | ||||||||
| State Bank of India | 17% | 7.2 | 9.3 | 1.4 | 9.0 | 16.4 | 1.2 | 17.2 |
| Bank of Baroda | 3% | 6.2 | 0.8 | 11.0 | 18.1 | 1.2 | 15.5 | |
| Punjab National Bank | 3% | 7.0 | 0.8 | 9.8 | 18.5 | 1.1 | 15.2 | |
| Canara Bank | 2% | 5.1 | 0.9 | 10.8 | 19.9 | 1.1 | 17.8 | |
| Private Sector Banks | ||||||||
| HDFC Bank | 33% | 11.7 | 20.7 | 2.8 | 20.8 | 20.8 | 1.7 | 14.5 |
| ICICI Bank | 22% | 18.9 | 3.2 | 13.0 | 15.3 | 2.2 | 17.9 | |
| Kotak Mahindra Bank | 9% | 20.4 | 2.5 | 17.3 | 22.0 | 2.7 | 15.4 | |
| Axis Bank | 7% | 11.6 | 1.7 | 13.6 | 14.2 | 1.8 | 16.3 | |
| IndusInd Bank | 1% | 49.0 | 0.9 | 17.5 | 3.9 | 0.5 | 4.2 | |
| AU Small Finance | 1% | 24.5 | 3.1 | 36.7 | 31.1 | 1.6 | 14.2 | |
| IDFC First Bank | 1% | 38.3 | 1.3 | 18* | 20* | 0.5 | 4.2 | |
| Federal Bank | 1% | 11.6 | 1.4 | 14.1 | 14.7 | 1.3 | 12.9 | |
As on 30th August 2025
For IDFC First Bank, Sales and Profit growth are for 5 years.
Key Insights:
- Private Banks Command Premium Valuations: Private banks like HDFC (20.7), ICICI (18.9), IDFC (38.3), etc., have higher valuations than Public Sector Banks—SBI (9.3), PNB (7.0), Canara (5.1), etc. This indicates investor confidence in private sector banks. At the same time, public sector banks, being at relatively low valuations, may present a good investment opportunity for investors.
- Growth Potential for Public Sector Banks (PSBs): While PSBs lag in ROE and ROA, steady improvements in topline growth and asset quality might indicate a structural turnaround.
Macroeconomic Environment of the Indian Banking System
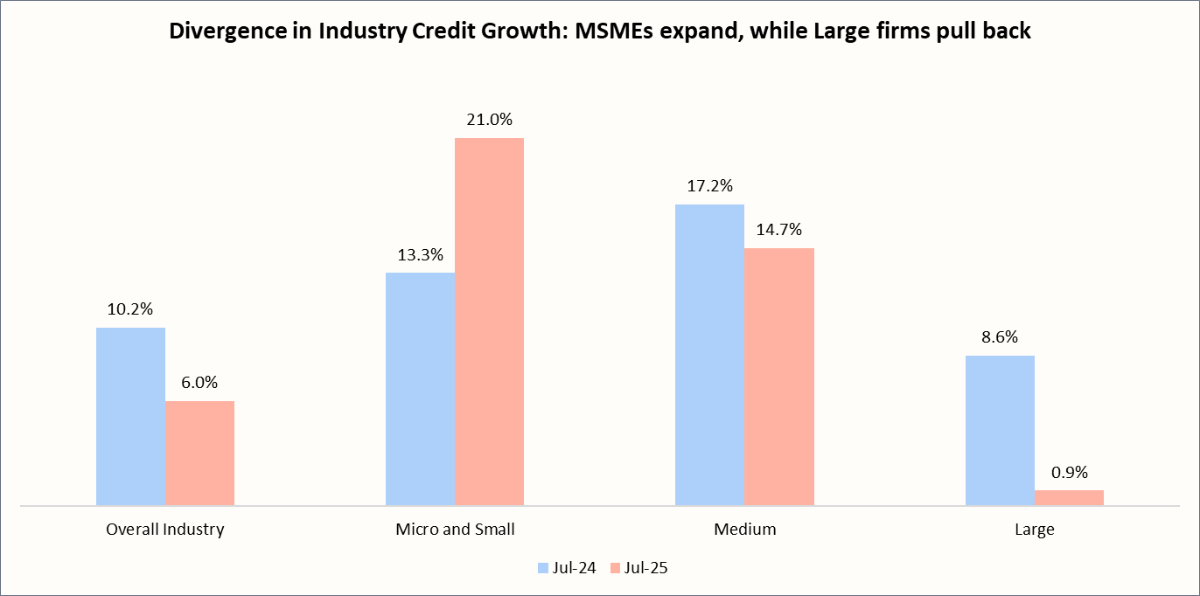
🔴 Slowdown in Credit Growth
Credit growth slowed to 10.2% in Jul-25, compared to 15.1% a year ago. In fact, credit demand has been on a steady decline since Aug-24 (15.46%), reflecting weak appetite for credit.
So, why is credit growth slowing down?
The answer is mixed. While aggregate credit has moderated, certain pockets, like MSMEs and retail loans, continue to expand. The slowdown is concentrated in corporate borrowing, which has declined for two key reasons:
- Alternative funding sources: Corporates are increasingly turning to external commercial borrowings (ECBs), commercial papers (CPs), and capital markets for funding instead of bank loans.
- Strong balance sheets: Many companies have built up excess cash reserves, reducing their reliance on external funding.
Bottom line:
RBI expects softer credit demand in the near term, driven by large corporates tapping internal accruals and bond markets instead of banks.
In the medium term, credit expansion is likely to pick up once policy transmission deepens. However, bank credit may grow more slowly than overall resource flows to the commercial sector, since non-bank sources (CPs, corporate bonds, ECBs) are gaining popularity.
🟡 Deposits and Credit Growth Find a Balance
Since April 2025, year-on-year deposit growth has held steady at around 10%, while credit growth has eased. This has brought the two onto similar footing, with credit and deposit growth converging. On the surface, slowing credit is a concern for the economy, but the balance between the two is not necessarily bad. When loan growth races ahead of deposits, banks are forced to keep deposit rates attractive to chase funds, squeezing margins and putting profitability at risk. A more even pace of growth reduces this pressure, giving banks breathing room on the funding side.
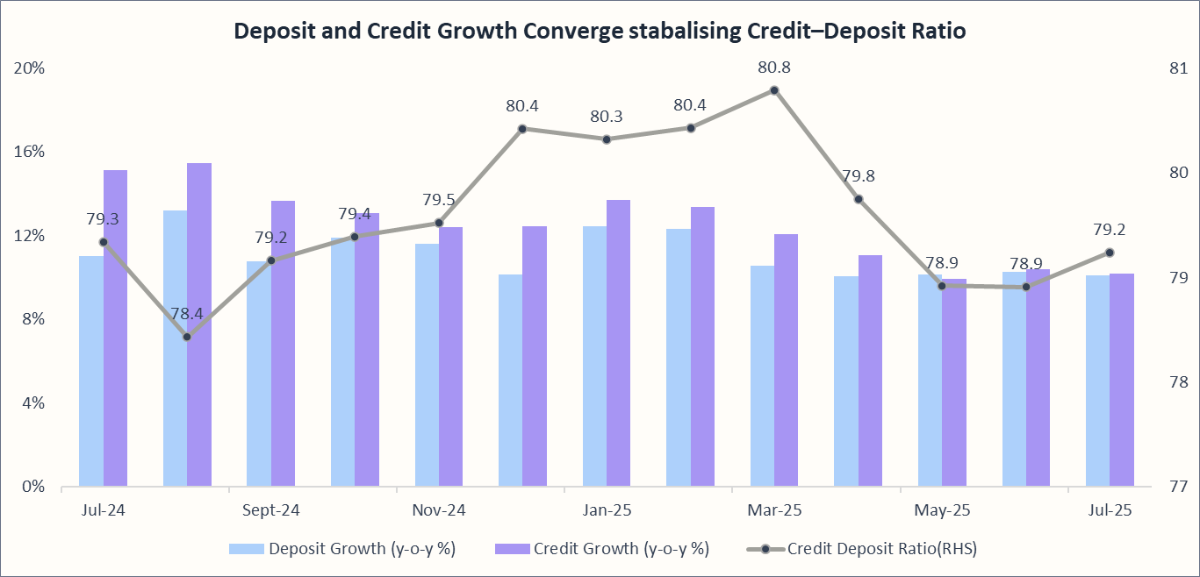
Why the Outlook Still Needs Caution
The credit–deposit ratio, now stable around 79–80%, signals healthier alignment. But the composition of deposits has shifted, term deposits have surged, while CASA (current account and savings account deposits) has lagged. This raises the cost of funds for banks, and in a falling interest rate cycle, loan yields (especially those linked to benchmarks) will drop faster than these fixed-rate deposits. That mismatch could narrow net interest margins (NIMs). The RBI’s recent CRR cut has softened some of this pressure, but banks will need to actively manage their liability mix.
In short, convergence is stabilising the system, but profitability will hinge on how banks handle the shift toward costlier deposits.
Here is how the share of CASA deposits and term deposits in total deposits has trended over the past three years:
| Year | CASA Deposits | Term Deposits |
| 2022-23 | 43.5% | 56.5% |
| 2023-24 | 41.0% | 59.0% |
| 2024-25 | 39.4% | 60.6% |
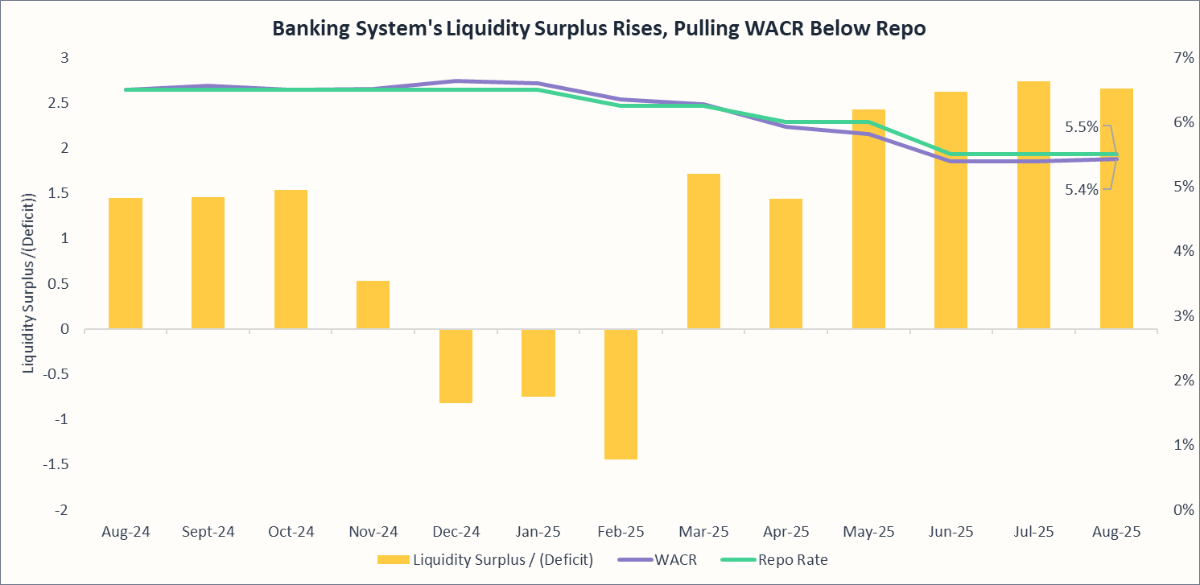
🟢 RBI Interventions Boost Liquidity during the year
The average net position under the liquidity adjustment facility (LAF), which measures the liquidity of the banking system, turned into a deficit during the months of Dec-24, Jan-25, and Feb-25, mainly due to:
- Advance Tax Payments in December 2024
- Capital Outflows
- Forex Operations and
- Significant pickup in currency circulation in January 2025.
RBI’s Steps to Ease Liquidity in 2025:
- CRR cut: In June 2025, the RBI announced to reduce the Cash Reserve Ratio (CRR) by 100 bps to 3%, releasing about ₹2.5 lakh crore into the system.
- Repo rate cut: At the same time, the repo rate was brought down by 50 bps to 5.5%, signaling a more accommodative stance.
- Market operations: Through Q4 FY25, the RBI injected liquidity using Open Market Operations (OMOs) in government securities and USD/INR buy–sell swaps.
- Auction changes: Daily Variable Rate Repo (VRR) auctions were stopped in June as liquidity improved, while large Variable Rate Reverse Repo (VRRR) auctions were introduced in July to absorb excess funds.
- LCR guidelines: In April 2025, the RBI revised Liquidity Coverage Ratio norms, lowering run-off rates for digital and corporate deposits. This is expected to release ₹3 lakh crore into the system from FY26, potentially boosting credit growth by ~2 percentage points
Impact on the Banking System:
- Liquidity swung from deficit (late 2024/early 2025) to surplus (mid-2025).
- Surplus liquidity is now around ₹2.5 lakh crore, the highest in three years.
- The WACR (weighted average call money rate) has stayed below the repo rate, showing easy liquidity- meaning banks are lending overnight short-term funds to each other at a lower rate than what the RBI is lending to them.
- Banks now borrow less from the RBI and lend to each other at cheaper rates.
Liquidity in the banking system is likely to stay in surplus through FY2026, giving banks both the comfort to fund credit growth and the benefit of smoother rate transmission. The RBI, however, will remain alert to inflation risks and step in to absorb excess when required. In other words, liquidity is no longer a constraint for the banking sector; it has become an enabler of stability and growth, with the central bank fine-tuning conditions as required.
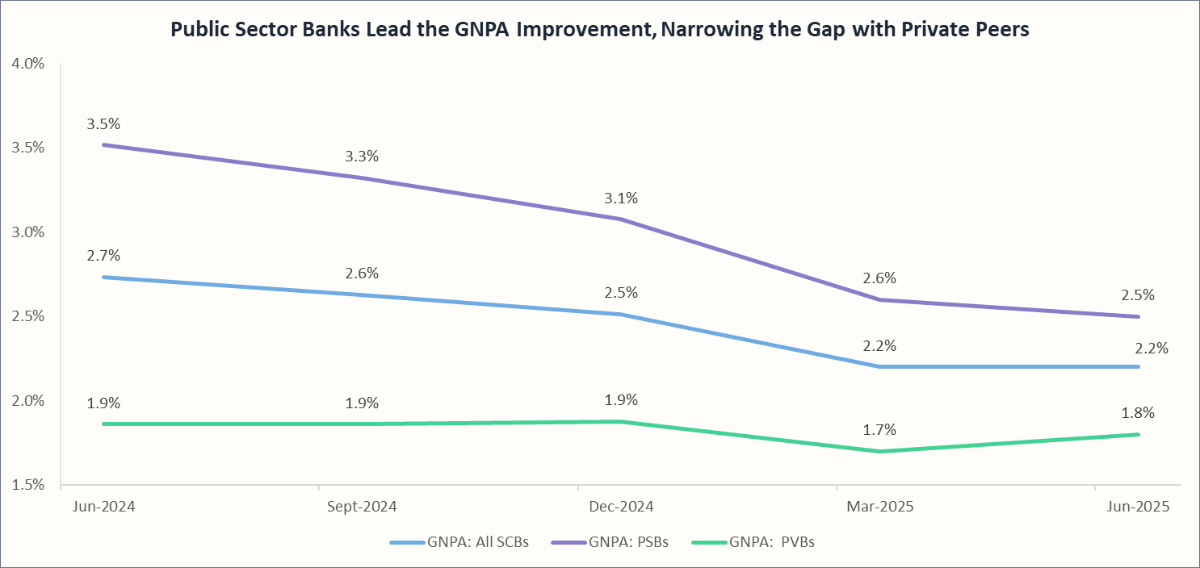
🟡 Delinquencies and Asset Quality
Indian banks continue to enjoy strong asset quality, with system-wide Gross NPAs easing further to 2.2% in Q1 FY26, down from 2.7% a year ago. Public sector banks saw the sharpest improvement, reducing NPAs to 2.5% from 3.3% a year ago, while private banks remained healthier at 1.8%. This reflects the gains from earlier balance sheet clean-ups and high provision coverage, particularly among PSBs.
That said, the quarter also revealed emerging fault lines. Credit costs ticked up from 0.4% to 0.6%, driven by stress in unsecured retail lending and MSME portfolios. Small Finance Banks and a few new private banks faced the steepest rise in delinquencies, especially in microfinance, where collection efficiency slipped.
Looking ahead, profitability in FY26 might be weighed down by higher provisioning and NIM pressures, even as overall stress is expected to remain contained. In other words, while NPAs are at multi-year lows, the key monitorable is the creeping rise in delinquencies in personal loans, credit cards, and MSMEs—segments that could shape the next phase of the credit cycle.
Final Thoughts
All in all, the Indian banking sector has entered FY2026 from a position of relative strength. Supportive RBI policies, surplus liquidity, and strong balance sheets have helped banks remain resilient despite global uncertainty. Credit demand remains muted and margin pressures persist, but with fundamentals intact and policy transmission improving, most banks expect momentum to recover in the second half of the year. One can therefore be cautiously optimistic about the sector’s performance ahead, with stability setting the stage for a gradual growth revival.
Recommended Reads
Looking for more sector insights? Explore these: