India’s labour market frequently makes headlines, sometimes for surprisingly low unemployment figures, other times for stubbornly high youth joblessness or persistently low female workforce participation. Understanding the unemployment rate in India requires more than a headline number. It means knowing how the rate is measured, what recent trends reveal, which groups are most affected, and which policy levers can realistically improve outcomes.
This blog unpacks each of these aspects to provide an evidence-based view of India’s job market and its near-term prospects.
What is the Unemployment Rate?
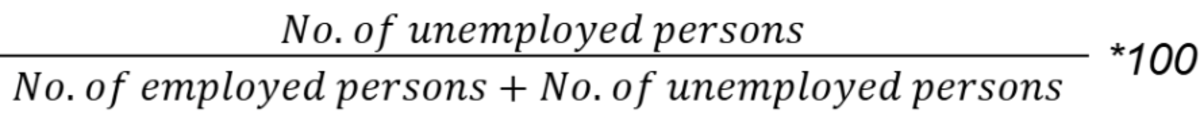
The unemployment rate represents the share of the labour force without work but actively seeking and available for work. Two companion indicators give a fuller picture:
- Labour Force Participation Rate (LFPR): The percentage of the working-age population that is employed or looking for work.
- Worker Population Ratio (WPR): The share of the working-age population actually employed.
A falling unemployment rate accompanied by rising LFPR and WPR is encouraging, while a decline driven by people exiting the labour force is not.
India’s primary data source is the Periodic Labour Force Survey (PLFS) from the Ministry of Statistics and Programme Implementation (MoSPI). After methodological upgrades in 2025, the PLFS now offers higher-frequency, more comparable rural and urban unemployment statistics.
💡How is the Unemployment Rate calculated?
UR= |
Types of Unemployment in India
India experiences multiple forms of unemployment, each shaped by different economic and social factors:
- Structural Unemployment: Occurs when workers’ skills do not match industry needs. For example, engineering graduates lack AI/ML training despite rising tech demand.
- Frictional Unemployment: Temporary unemployment during job changes, such as IT professionals switching firms after layoffs or seeking better opportunities.
- Seasonal Unemployment: Common in agriculture and tourism-heavy states like Himachal Pradesh or Goa, where employment fluctuates with harvests or tourist seasons.
- Cyclical Unemployment: Triggered by economic slowdowns or global recessions that reduce demand for goods and services, leading to job losses in export-driven sectors.
- Disguised Unemployment: Seen in rural agriculture, where surplus labour contributes little to productivity, meaning more people work than are actually needed.
Recommended for you
Readers also explored

Wholesale Price Index: Key to Inflation and Economic Trends

Currency in Circulation: How Much Money Exists in the World?
Recent Unemployment Trends in India- November 2025
India's unemployment rate has shown a welcome decline in recent years, signalling a gradual recovery and improvement in the labour market. According to the Periodic Labour Force Survey (PLFS) by the Ministry of Statistics and Programme Implementation (MoSPI), the overall unemployment rate for persons aged 15 and above has steadily fallen.
The latest data available indicates a continued downward trajectory, with the unemployment rate easing to 4.7% in November 2025, a decrease from 5.2% in October of the same year. This positive trend is attributed to improvements in both rural and urban job markets, with a notable decline in male and rural unemployment rates.
Latest Numbers at a Glance (November 2025):
Key highlights from the November 2025 release:
| Indicator | November 2025 | October 2025 | Trend |
|---|---|---|---|
| All-India Unemployment Rate (15+ yrs) | 4.7% | 5.2% | ▼ Improving |
| Rural Unemployment | 3.9% | 4.4% | ▼ Slight fall |
| Urban Unemployment | 6.5% | 7.0% | ▼ Modest decline |
| Male Unemployment | 4.6% | 5.1% | ▼ Eight-month low |
| Female Unemployment | 4.8% | 5.4% | ▼ Improving |
| Labour Force Participation Rate (LFPR, 15+ yrs) | 55.8% | 55.4% | ▲ Slight Uptick |
| Female LFPR | 35.1% | 34.2% | ▲ Gradual rise |
| Male LFPR | 77.4% | 77.4% | ▼ No Change |
| Worker Population Ratio (WPR) | 53.2% | 52.5% | ▲ Improving |
| Youth (15–29 yrs) Unemployment | 14.1% | 14.9% | ▼ Slight fall |
What the Data Reveals?
Overall Unemployment Is Coming Down, But Slowly
India’s unemployment rate has eased, settling at 4.7% in November 2025, down from 5.2% in October and a peak of 5.6% in June. This downward drift, though modest, indicates a labour market that is gradually stabilising after a period of global economic uncertainty and domestic election-related slowdown.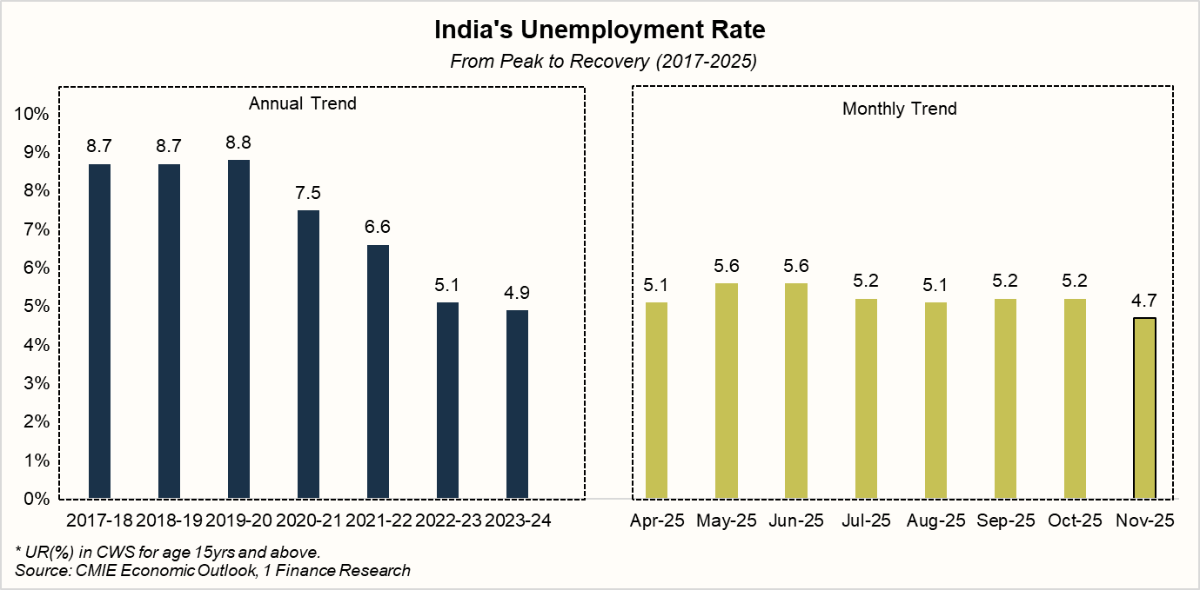
Urban Unemployment Remains Higher and More Volatile
The urban unemployment rate stands at 6.5%, significantly above the rural rate of 3.9%. Cities typically host more formal jobs in services, technology, and manufacturing; however, these sectors are more susceptible to fluctuations in global demand and automation.
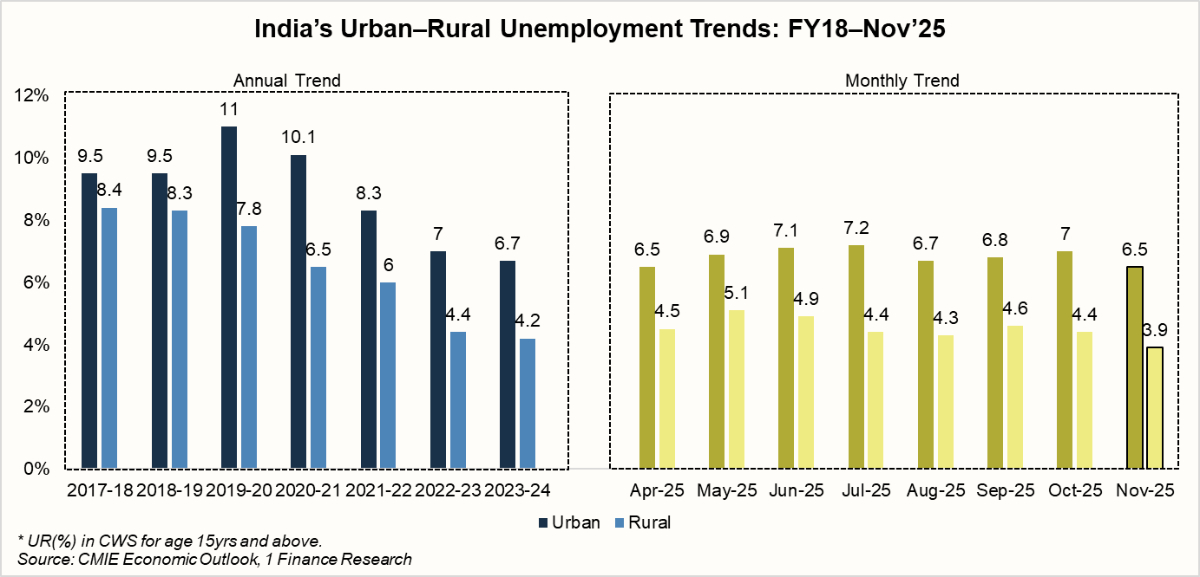
This persistent rural–urban gap highlights the need for targeted policies such as urban skilling programs, start-up incubation, and affordable housing, which can reduce friction in city job markets and help workers transition to higher-productivity roles.
Gender Gap Persists Despite Small Gains
Male unemployment fell to an eight-month low of about 4.6%, and female unemployment edged down slightly to 4.8%. Encouragingly, female labour force participation (LFPR) rose to 35.1%, indicating that more women are either seeking work or have found jobs.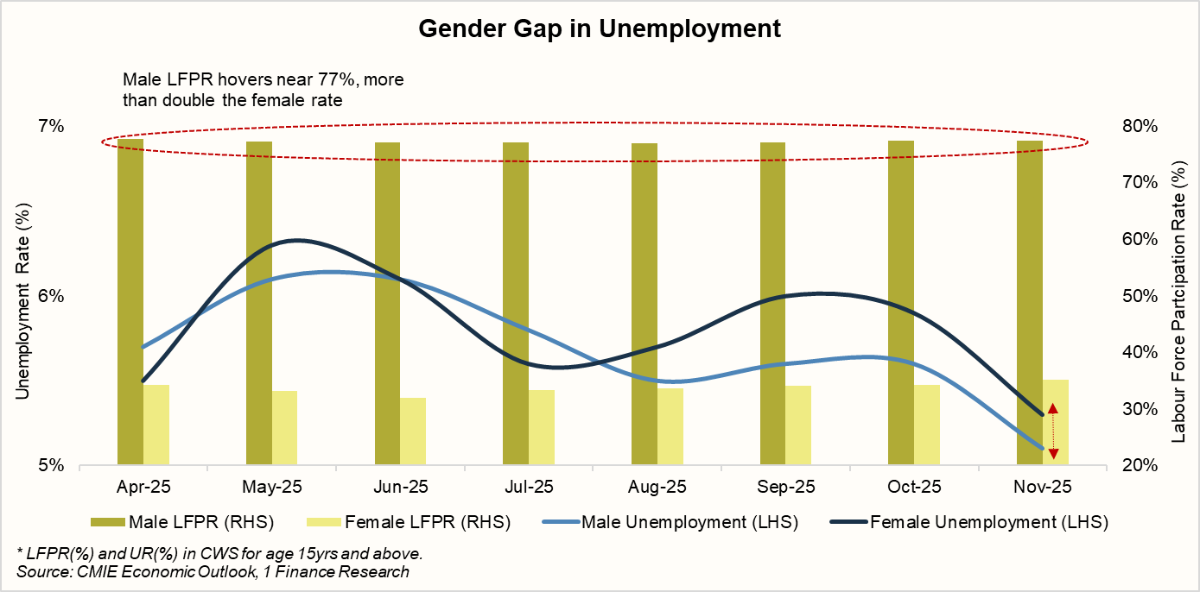
The silver lining is that rural India is showing stronger female LFPR growth, aided by self-help groups, agricultural cooperatives, and government initiatives such as Women Entrepreneurship Platforms. Sustaining this momentum will require policy incentives for companies to hire women, improved transport infrastructure, and expanded childcare facilities.
Youth Remain Vulnerable to Joblessness
India’s youth unemployment rate (ages 15–29) has eased to 14.9% in November 2025 from the peak of 17.8% in September 2025. Within this group, female youth unemployment (~16.3%) far exceeds male youth unemployment (~13.4%), underscoring persistent gender disadvantages.
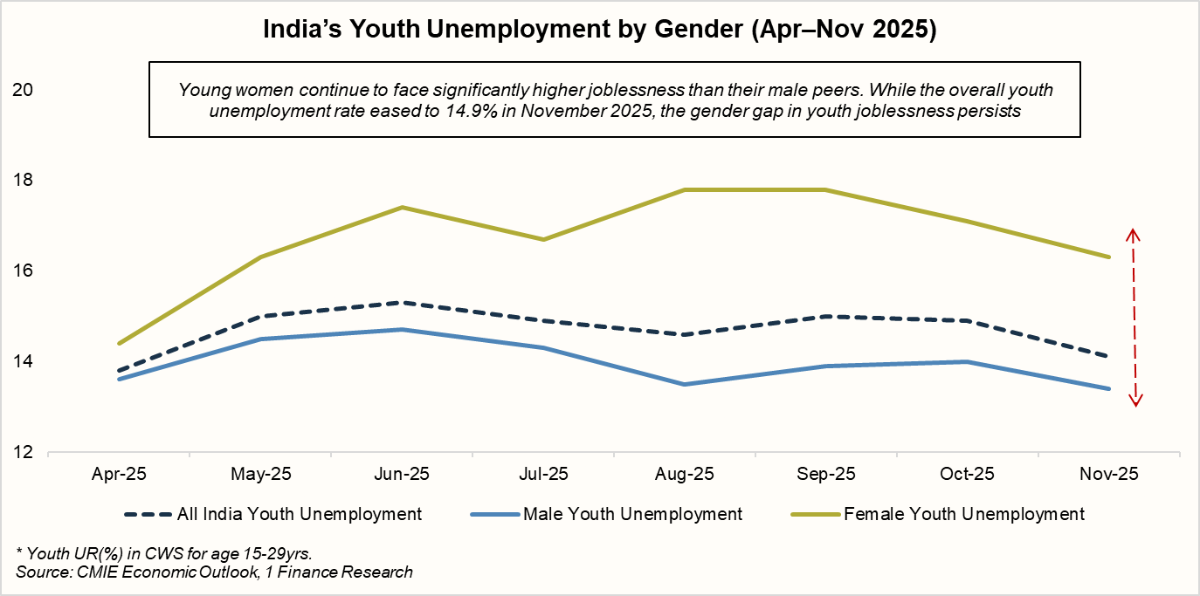
This challenge reflects a skills mismatch: while educational attainment has improved, many graduates lack the industry-ready skills demanded in high-growth areas such as artificial intelligence, advanced manufacturing, and renewable energy.
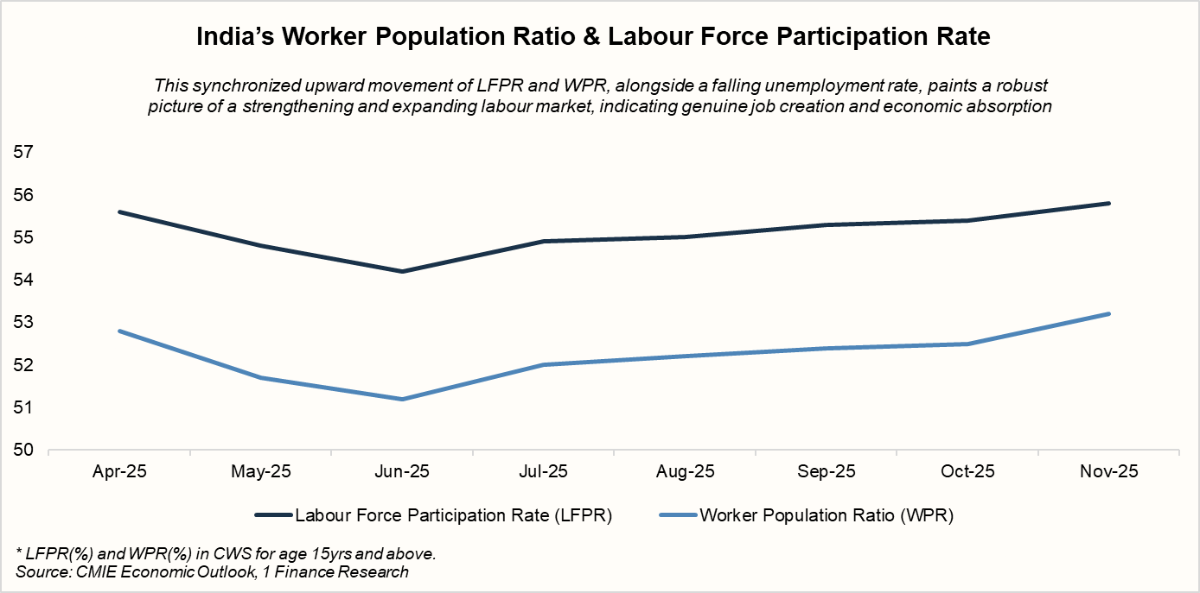
Labour Force Participation and Worker Ratios Are Improving
A silver lining is the steady increase in participation. The Labour Force Participation Rate (LFPR) for individuals aged 15+ has inched up to 55.8%, meaning more people are actively working or seeking work.Similarly, the Worker Population Ratio (WPR)- the share of the working-age population actually employed- has risen to 53.2%, suggesting that many of those re-entering the labour force are successfully finding jobs.
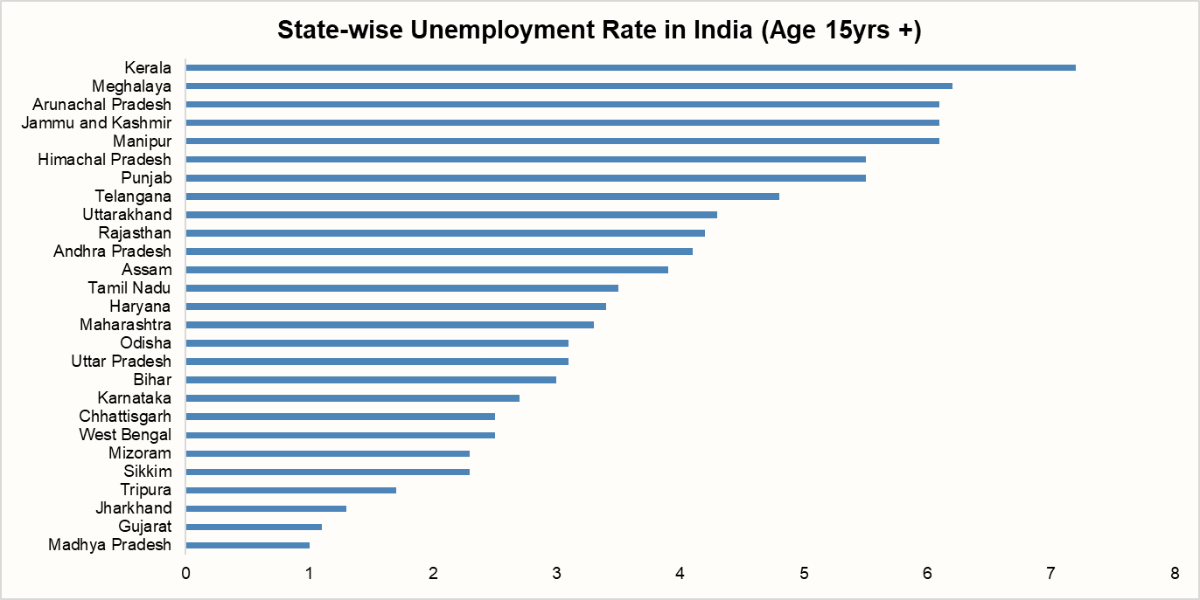
State-wise Unemployment Trends in India
India’s latest PLFS (2023-2024) data reveal sharp regional gaps in joblessness. Goa, Kerala and Meghalaya top the list with unemployment rates above 6%, followed by Arunachal Pradesh, Jammu & Kashmir and Manipur, highlighting weak job creation and seasonal employment challenges. In contrast, industrial hubs like Gujarat and Madhya Pradesh maintain rates below 1.5%, reflecting stronger labour absorption. These variations show how tourism dependence, skill mismatches and uneven industrial growth drive state-level unemployment.
Urban areas are generally more affected than rural areas, largely due to higher aspirational thresholds, better reporting, and a mismatch between available jobs and preferred sectors.
Source: MoSPI, 1 Finance Research
Why Does India Struggle with Unemployment?
Several structural and cyclical factors underpin India’s job market challenges:
- Population Dynamics: Over 10 million new job seekers enter the workforce annually, creating constant pressure to generate employment opportunities.
- Skill Mismatch: The education system often prioritises degrees over job-ready skills, leaving graduates unprepared for high-tech roles.
- Automation and Digitisation: AI and robotics are replacing low- and mid-skill tasks in manufacturing and services.
- Informal Sector Dominance: Over 40% of the workforce remains in agriculture, where productivity gains reduce the need for labour.
- Gender and Social Disparities: Marginalised groups such as women, scheduled castes, and rural residents face additional barriers, including social norms, discrimination, and poor accessibility to job markets.
Government Initiatives to Tackle Unemployment
To address rising joblessness and build a resilient employment ecosystem, the Indian government, over the last few years, has rolled out a broad set of schemes, policies, and stimulus packages. The following table highlights some key initiatives directly focused on employment generation and skill development.
(Note: While some programs date back a few years, their ongoing impacts and recent enhancements remain relevant in 2025).
| Scheme/Initiative | Objective & Key Features |
|---|---|
| Pradhan Mantri Mudra Yojana (PMMY) | Provides collateral-free loans (up to ₹10 lakh) to micro and small enterprises to promote self-employment and entrepreneurship. |
| Prime Minister’s Employment Generation Programme (PMEGP) | Generates employment by supporting new micro-enterprises in manufacturing and service sectors with credit-linked subsidies. |
| Pradhan Mantri Rojgar Protsahan Yojana (PMRPY) | Incentivises employers to generate new employment opportunities. |
| National Career Service (NCS) Project | Provides career-related services like job search assistance and counselling. |
| Atmanirbhar Bharat Rojgar Yojana (ABRY) | Incentivises employers to create new jobs by providing EPF contribution support for new hires. |
| Aajeevika - National Rural Livelihoods Mission (NRLM) | Reduces poverty by enabling access to self-employment and skilled wage employment. |
| Skill India Mission / Pradhan Mantri Kaushal Vikas Yojana (PMKVY) | Enhances employability by providing market-relevant skills and training to young people across various sectors. |
| Garib Kalyan Rojgar Abhiyaan (GKRA) | Provides immediate employment in rural areas for migrant workers affected by the pandemic through public works projects. |
| Mahatma Gandhi National Rural Employment Guarantee Scheme (MGNREGS) | Guarantees 100 days of wage employment per year to rural households, ensuring income security and rural infrastructure development. |
| Pt. Deen Dayal Upadhyaya Grameen Kaushalya Yojana (DDU-GKY) | Focuses on skill development and job placement for rural youth, especially from low-income families. |
| National Apprenticeship Promotion Scheme (NAPS) | Promotes apprenticeship training in the country. |
Why Unemployment Matters for Advisors
For financial advisors, unemployment data is more than an economic statistic; it’s a forward-looking market signal.
| Scenario | Financial Asset | Impact | Why? | Advisor Action |
|---|---|---|---|---|
| Falling UR | Equities |  | Rising incomes boost consumer spending & corporate profits. | Increase exposure to cyclical sectors (FMCG, autos, retail). |
| Debt |  | Central banks may raise rates to curb inflation, lowering bond prices. | Consider short-duration bond; monitor for rate hike cues. | |
| Gold | | Economic optimism reduces demand for safe havens. | Reduce exposure to gold ETFs. | |
| INR | | Strong economy attracts foreign investment, strengthening the rupee. | Reduce currency hedges on foreign investments. | |
| Rising UR | Equities | | Reduced consumer demand and revenue. | Rotate into defensive sectors (utilities, healthcare) & focus on quality. |
| Debt | | Central banks may cut rates to stimulate the economy, boosting bond prices. | Consider long-duration bonds for capital appreciation. | |
| Gold | | Uncertainty and market volatility increase demand for safe havens. | Increase allocation to gold ETFs as a hedge. | |
| INR | | Investor confidence erodes, leading to capital outflow. | Hedge forex exposure for international portfolios. |
Conclusion
India’s unemployment rate may be drifting lower, but youth joblessness, gender gaps, and structural mismatches remain formidable challenges.
For investors and financial advisors, labour-market trends are not just social indicators; they are leading signals for portfolio strategy. A falling rate often signals brighter days for equities and a stronger rupee, while a rise whispers caution, calling for bonds, gold, and a more defensive stance. For financial advisors, this isn’t just economic trivia; it’s a practical guide to rebalancing portfolios before the crowd catches on. Staying curious about job trends can help you spot turning points early, protect client wealth, and even find hidden opportunities when the market mood suddenly changes.