Entering FY26, the investment environment is complex. With global trade shifts and uneven capital flows, clear investment strategies are hard to identify. This article provides actionable insights into different asset classes and macroeconomic factors to support informed decision-making. It explores the importance of diversification, analyses the performance of various asset classes through an Asset Allocator Quilt, examines their reward-to-risk ratios, and offers practical tools, such as the equity glide path approach, to tailor investments based on macroeconomic cycles.
The Asset Allocator Quilt 2025: A Visual Lesson in Diversification
Markets rarely reward the same asset class year after year. Leadership constantly rotates, Bitcoin’s peaks were matched by steep falls, equities traded leadership across market caps, gold quietly protected during stress, debt provided steady returns, and REITs & InvITs held the middle ground. The message is clear: past winners don’t guarantee future success. A balanced, diversified allocation is the surest way to withstand shifting market cycles
| 2018 | 2019 | 2020 | 2021 | 2022 | 2023 | 2024 | 2025 (to date) | Last 5-Year CAGR |
|---|---|---|---|---|---|---|---|---|
Gold 7% | BTC 92% | BTC 311% | BTC 62% | Silver 15% | BTC 155% | BTC 129% | Gold 25% | BTC 68% |
Debt 7% | Gold 23% | Silver 52% | Smallcap 62% | Gold 14% | Smallcap 48% | Smallcap 26% | Silver 25% | Smallcap 34% |
Real Estate 6% | DME 21% | Gold 26% | Midcap 47% | Real Estate 10% | Midcap 44% | Silver 25% | DME 17% | Midcap 31% |
Lg Cap 3% | Silver 18% | Smallcap 25% | Lg Cap 24% | REITs & InvITs 9% | Lg Cap 20% | Midcap 24% | BTC 14% | Lg Cap 20% |
Silver 0% | Real Estate 14% | Midcap 24% | REITs & InvITs 18% | Debt 5% | DME 15% | Gold 20% | REITs & InvITs 10% | Silver 18% |
DME -8% | Lg Cap 12% | Lg Cap 15% | DME 11% | Cash 5% | Gold 14% | REITs & InvITs 16% | Lg Cap 8% | REITs & InvITs 14% |
Midcap -13% | Debt 9% | Real Estate 10% | Real Estate 8% | Lg Cap 4% | Debt 8% | Real Estate 14% | Debt 5% | Gold 13% |
Smallcap -27% | REITs & InvITs 9% | Debt 9% | Debt 4% | Midcap 3% | Cash 7% | Lg Cap 9% | Real Estate 5% | DME 11% |
BTC -71% | Cash 6% | DME 8% | Cash 3% | Smallcap -4% | Real Estate 6% | Debt 8% | Midcap 4% | Real Estate 10% |
Midcap 0% | REITs & InvITs 6% | Silver -10% | DME -7% | REITs & InvITs 1% | Cash 7% | Cash 3% | Debt 7% | |
Smallcap -8% | Cash 3% | Gold -5% | BTC -60% | Silver 0% | DME 4% | Smallcap 0% | Cash 5% |
As of Aug 07, 2025
| Abbr. | Asset Class | Index | Best | Worst |
|---|---|---|---|---|
| Lg Cap | Large Cap Equities | Nifty 50 | 24% | 9% |
| Midcap | Midcap Equities | Nifty Midcap 150 | 47% | -13% |
| Smallcap | Smallcap Equities | Nifty Smallcap 250 | 62% | -27% |
| Real Estate | Real Estate | 1 Finance Housing TRI | 18% | 1% |
| REITs & InvITs | REITs & InvITs | Nifty REITs & InvITs TRI | 18% | 1% |
| Gold | Gold | UTI Gold ETF | 26% | -5% |
| Silver | Silver | Silver (INR terms) | 52% | -10% |
| BTC | Bitcoin | Bitcoin (INR terms) | 311% | -60% |
| DME | Developed Market Equities | MSCI EAFE Index (INR terms) | 21% | -8% |
| Debt | Debt | Aditya Birla SL Liquid Fund(G), ICICI Pru All Seasons Bond Fund(G), ICICI Pru Short Term Fund(G). | 9% | 4% |
| Cash | Cash | Nifty 1D Rate Index | 7% | 3% |
As of Aug 07, 2025
Please note that the returns presented in the Asset Allocator Quilt are calculated on a calendar year basis. The 5-year CAGR is calculated between Jun-20 and Jun-25.
Recommended for you
Readers also explored
Understanding Portfolio Reward to Risk Ratio

Currency in Circulation: How Much Money Exists in the World?
Current Macroeconomic Situation of Various Asset Classes
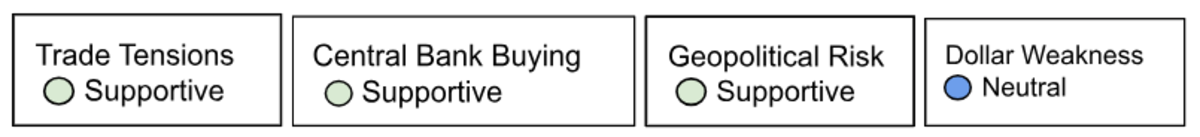
It is essential to consider macroeconomic factors when analysing asset classes, as they often dictate performance trends and investment outcomes. Below is a detailed analysis: Supportive (green) indicates the factor’s current strength is likely to boost the asset’s performance; Neutral (blue) means the factor is balanced with minor impact; and Non-Supportive (red) signals a potential risk that could weigh on performance.
Gold
Gold has risen from ₹98,079 (July 28, 2025) to ₹1,01,350 per 24K/10gm (Aug 13, 2025), boosting investor wealth. Heightened macro uncertainty, driven by U.S. tariffs, including a 50% levy on India over Russian oil, has prompted portfolio shifts toward gold. While USD strength has capped gains, expected dollar weakness in 2026 may provide support. Given its low equity correlation (-0.04) and 0.7x reward-to-risk, a mild allocation remains recommended.
Debt
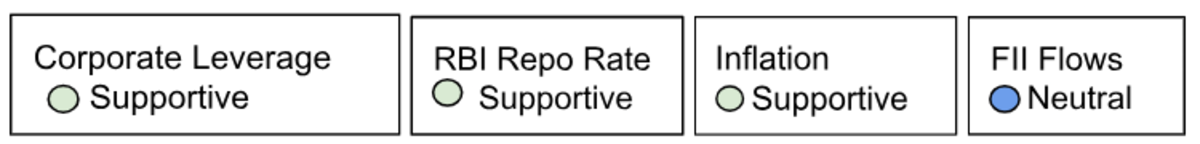
Retail inflation hit a record low of 1.6% in Jul-25 (from 2.1% in Jun-25) , offering relief, though a weaker rupee could raise import costs. The RBI has paused rate cuts at 5.50%. Foreign investors withdrew $2.88 billion in June, reversing March’s $5.81 billion inflows, driven by rising U.S. yields, geopolitical risks, and currency swings.
Corporations are turning to bond markets over bank loans. If U.S. rates fall, RBI policy stays steady, and inflation remains low, Indian debt could attract strong foreign inflows in late 2025. Debt also offers a reward-to-risk ratio of 7.2x and has a low correlation with real estate, making it an effective portfolio diversifier.
Equities
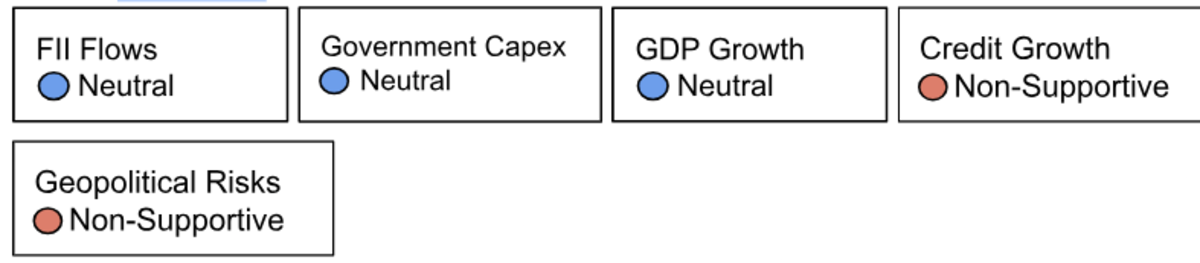
Indian large-cap, mid-cap & small-cap equities remain highly sensitive to macro drivers such as FII flows, GDP growth, government capex, RBI policy, and credit growth. While the government has raised FY26 capex to ₹11.2T (up 10.1% YoY) and maintained its infrastructure push, uncertainties persist—slowing GDP growth, weaker non-food credit growth (9.8% YoY vs. 16.2% last year), and global volatility.
FII flows have been volatile, with heavy March outflows (-$13.34B) followed by a partial June recovery (+$4.54B). These swings underscore the influence of sentiment and global conditions. Stay cautious—hold existing positions and continue SIPs. Equities offer long-term, inflation-beating potential with a 0.7x reward-to-risk ratio.
Bitcoin
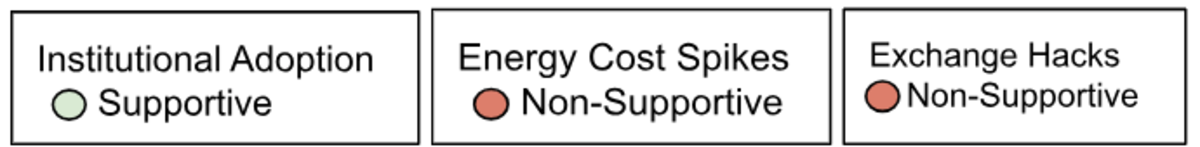
Bitcoin has surged past $121,000 (Aug 11, 2025), setting a new milestone and drawing global attention. Institutional adoption remains a key driver, with more firms viewing BTC as a store of value and inflation hedge.
However, two major risks stand out. Exchange hacks have already stolen over $3.1B in crypto in the first half of 2025 (exceeding all of 2024), triggering panic and eroding market confidence. Rising energy costs are another concern, as they can squeeze mining profitability and potentially weaken the network.
BTC’s extreme volatility, historically with max drawdowns of up to 74%, makes risk management critical. The observed reward-to-risk ratio of Bitcoin is 0.8x. For portfolios with an allocation to Bitcoin, a long-term investment approach is more advisable than short-term trading.
Silver
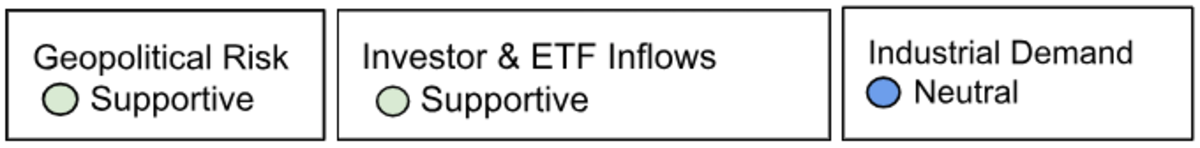
There are many macroeconomic variables that can impact silver as an asset class, with key determinants being industrial demand, geopolitical risks, and ETF inflows. Industrial demand may ease slightly this year but is expected to rebound in 2026, led by photovoltaics and electronics.
Central bank purchases and safe-haven flows amid geopolitical tensions are also supportive. Since June 2024, Silver ETF AUM has surged 125.7% to ₹16,866 crore (May 2025). Silver’s reward-to-risk ratio stands at 0.47x. Maintain exposure through Silver ETFs, but stay prepared for high volatility.
Portfolio Strategy for Every Macroeconomic Phase: From Growth to Recession
Where should one begin? Our Asset Allocator Model identifies the optimal portfolio mix by considering the unique traits of each macroeconomic phase alongside the investor’s age. For example, the chart shows recommended allocations for ages 36-45 across phases from Growth to Recession, covering Equity, Real Estate, REITs & InvITs, Debt, and Gold.
- Equity: Allocations to equities decrease from 45% during growth periods to 33% in a recession as risks increase.
- Gold: Gold allocations remain low during growth phase (11%) but increase to 15% in recoveries, serving as a hedge in weak recoveries and driven by cultural buying in strong ones. It also acts as a defensive asset during downturns.
- Safer Assets: During downturns, allocations to safer assets like REITs & InvITs and Debt increase to mitigate risk.
- Real Estate: Allocations stay steady at 24-30% across cycles, providing diversification and gaining share as funds shift out of riskier equities.
Explore how we have defined various economic phases →
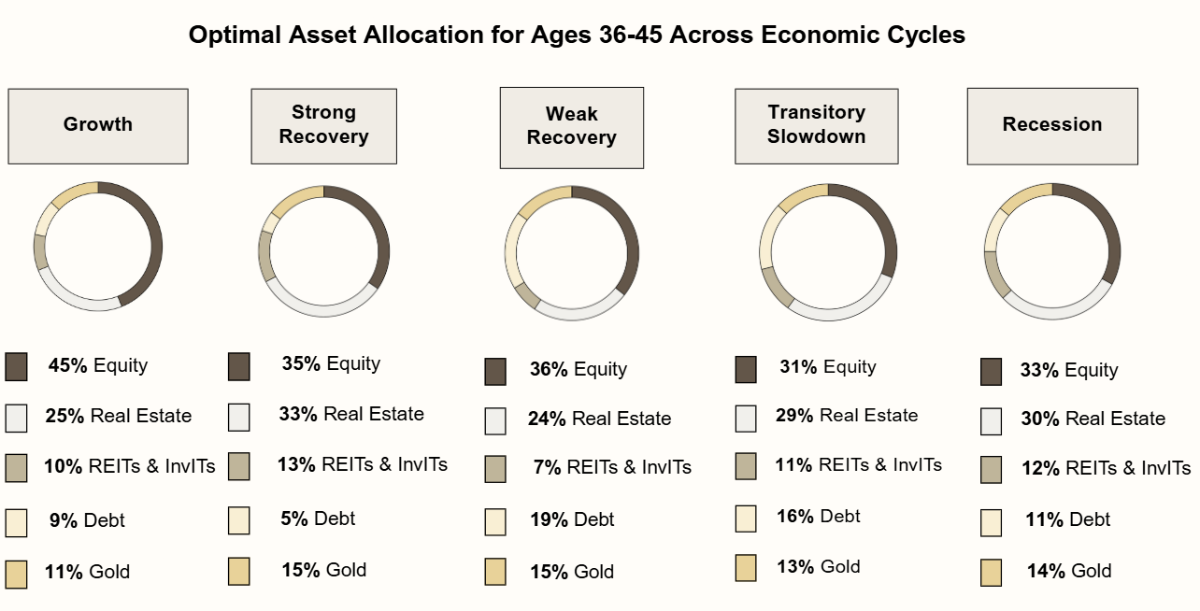
As of June 30, 2025
While this provides a strong strategic foundation, effective asset allocation should also incorporate individual considerations such as financial goals, personal circumstances, and liquidity requirements to ensure the portfolio remains aligned with an individual's specific needs.
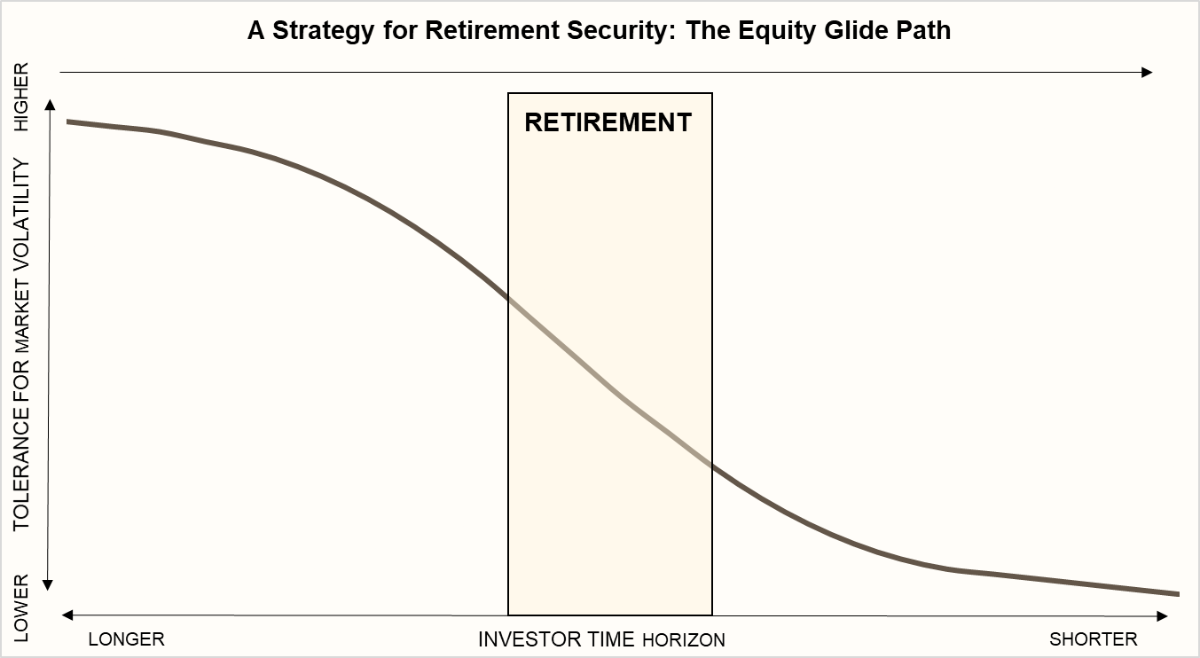
Equity Glide Path: Reducing Risk As Retirement Nears
Effective asset allocation demands alignment with investment time horizon, goals and life stage. The equity glide path helps by gradually reducing equity exposure as retirement nears, shifting from growth-focused, higher-volatility portfolios in early years to more stable, income-oriented allocations later. This approach balances return potential with capital preservation, ensuring portfolios remain well-positioned through market cycles while meeting evolving investor needs. Age isn’t just a number, it’s a key driver of long-term investment strategy.
The investment environment for FY26 is defined by its complexities, making a static approach to asset allocation a risk in itself. As this analysis has shown, the key to building a strong portfolio lies in a dynamic strategy that embraces diversification and adapts to macroeconomic realities. By understanding that no single asset class consistently outperforms, and by adjusting asset allocation to both the prevailing economic phase and personal lifecycle (via a glide path), one can move beyond short-term market noise. Ultimately, an informed, diversified, and personalised approach is the best tool for managing the year ahead and securing long-term financial goals.