India’s growth story remains intact, but the tailwinds have become more mixed. After an unexpectedly strong start to FY26, with real GDP accelerating to 7.8% in Q1 FY26, the economy looks strong on headline metrics. Yet beneath that headline are fresh and evolving global and domestic risks that could test the durability of the expansion over the next 3-6 months.
Trade & Tariffs
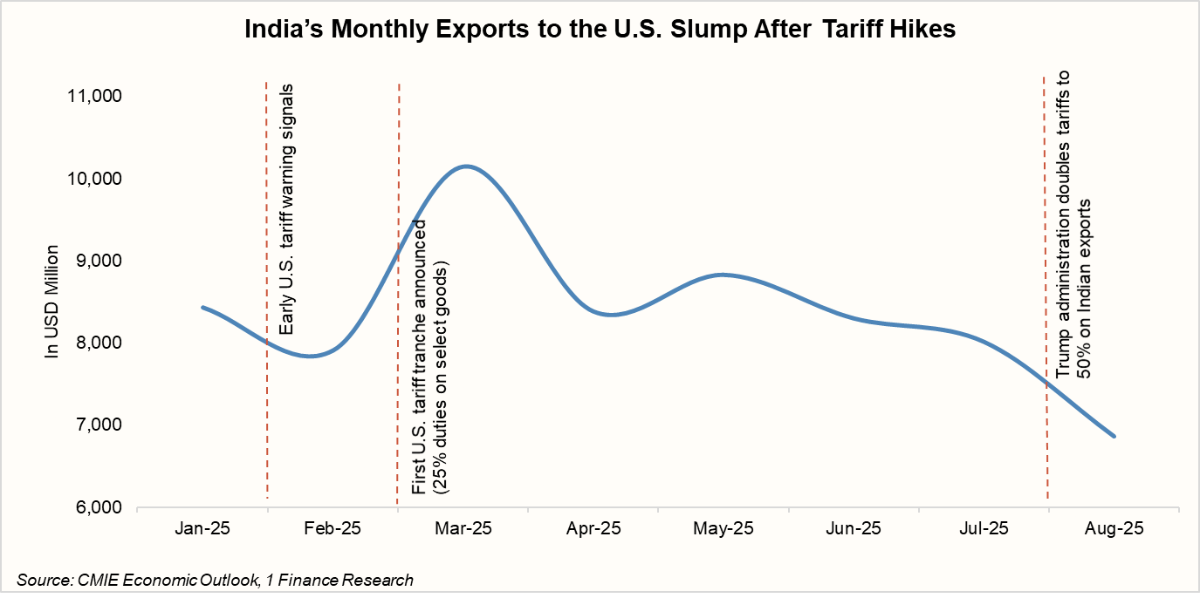
The U.S. decision to double tariffs to 50% on key Indian exports - textiles, gems & jewellery, footwear, furniture, and chemicals- has already slowed outbound shipments and threatens millions of export-linked jobs. September’s escalation, adding a 100% duty on branded pharmaceutical imports (a sector driving ~35% of India’s U.S. trade surplus), squeezes exporter margins and risks retaliatory measures. Beyond immediate earnings pressure, it clouds India’s manufacturing ambitions.
Rupee Weakness
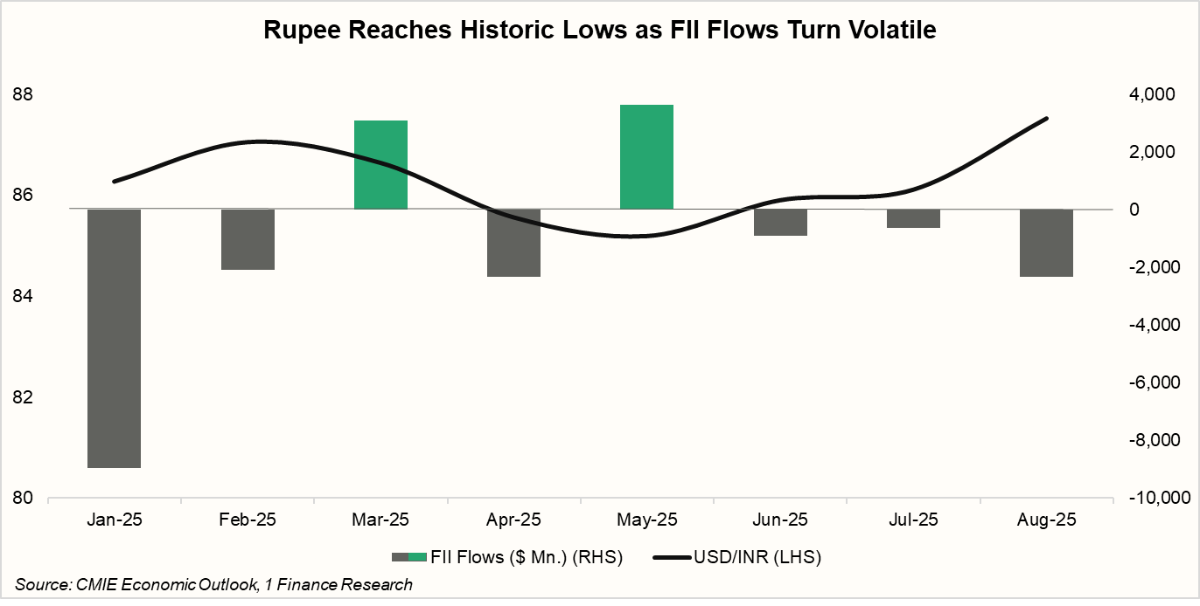
The INR breached 88.7 per USD, approaching record lows as persistent FPI outflows, higher U.S. real yields, and elevated oil prices widen the current-account deficit (CAD). A weaker rupee inflates import costs, from crude to electronics, fuels inflation, and adds pressure on corporate margins. Volatility also raises risk premia, complicating RBI’s monetary management and investor sentiment.
Recommended for you
Readers also explored
India’s GDP Growth: Challenges and Future Outlook 2025

India’s Unemployment Rate in 2025
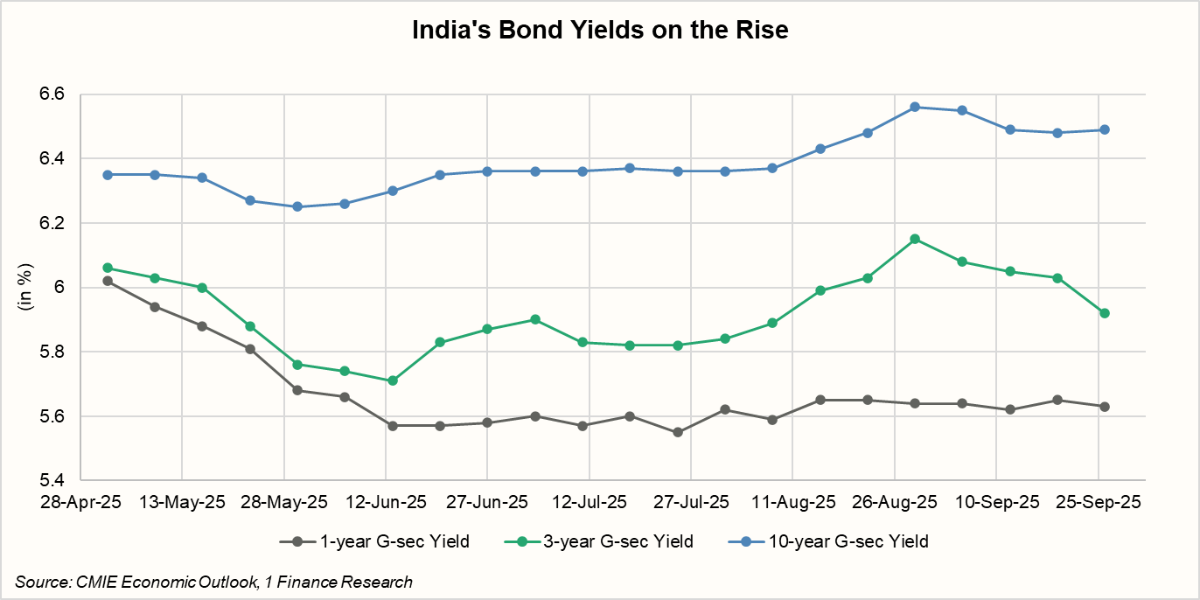
Rising Bond Yields
Even as the RBI cut rates earlier this year, 10-year G-sec yields spiked to 6.6% in late August. Initial optimism from S&P’s rating upgrade faded after GST rate cuts raised fears of higher fiscal deficits, with revenue loss estimated at ₹48,000 crore. Slower nominal GDP growth, tariff risks, and weak demand from banks and insurers added pressure. With the RBI pausing Open Market Operations, markets had to absorb extra supply, pushing yields higher. Yields eased once fiscal clarity emerged, but going forward, debt markets remain sensitive to government borrowing, inflation trends, and foreign inflows, keeping investors alert.
The Headline Risks to Watch Out For
India’s fundamentals remain strong, bolstered by robust Q1 momentum and GST simplifications, but external tariffs and domestic disruptions exacerbate vulnerabilities. Investors and advisors must closely track these for effective portfolio adjustments. Below is a snapshot of key risks shaping the outlook as of September 2025:
Risk Event | Event Description | Impact on Markets | Expected Direction of Impact |
|---|---|---|---|
| U.S. Trump Tariffs | The U.S. announced a punitive tariff (up to 50%) on selected imports and a 100% tariff on pharma imports — a targeted shock to trade and services linkages. | Indian IT and Textile Sector | ▼ |
| Indian Pharma Sector | ▼ | ||
| USD/INR | ▲ | ||
| Gold | ▲ | ||
| Exports | ▼ | ||
| Rupee Depreciation | INR trading near record lows amid trade/visa friction and weaker inflows | USD/INR | ▲ |
| Gold | ▲ | ||
| Crude Oil (INR) | ▲ | ||
| Indian Corporate Bond Yields | ▲ | ||
| Rising Bond Yields | India 10Y benchmark yield climbed to ~6.50%, driven by increased government borrowing and heavier bond supply. | Indian Govt. Bond Yields | ▲ |
| Indian Corporate Bond Yields | ▲ | ||
| Indian Real Estate | ▼ | ||
| U.S. H1B Visa Fee Hike | The U.S. imposed a $100,000 annual fee on new H-1B visa applications, massively increasing the cost for companies sponsoring Indian workers. | Indian IT Sector | ▼ |
| Remittances | ▼ | ||
| USD/INR | ▲ | ||
| North India floods | Heavy rains submerged crops in Punjab-Haryana, causing ₹5,000 crore agri losses and supply disruptions | Food Inflation | ▲ |
| Agri Stocks/Commodities | ▼ | ||
| Rural Demand | ▼ | ||
| U.S. Fed Rate Cut Volatility | Fed lowered funds rate to 4.00-4.25%, first cut in >1 year, to sustain U.S. growth. | Indian Large Cap Equities | ▲ |
| USD/INR | ▼ | ||
| Indian Bond Yields | ▲ | ||
| FPI Inflows | ▲ | ||
| Manufacturing slowdown | Industrial production remains subdued amid weak demand and global headwinds | Employment | ▼ |
| Bank Credit Growth | ▼ | ||
| Indian Corporate Bond Yields | ▼ | ||
| Energy Demand | ▼ | ||
| Delay in private capex revival | Firms delay capacity expansion due to high borrowing costs or uncertainty | Indian Banks | ▼ |
| Infrastructure Demand | ▼ | ||
| Bank Liquidity | ▲ | ||
| Indian Real Estate | ▼ |
A Health Check on India’s Macro Fundamentals
What India's Key Indices Reveal Amid Global Uncertainty
To complement our Risk Outlook, we turn to the 1 Finance Sub-Indices, which track real-time economic momentum across key sectors. These offer a ground-level view of how India’s economy is holding up under pressure.
Here's how the economy is tracking across major dimensions as of August 2025:
| Service Sector Activity 👍 | Latest Month | Vs. Last Year | Vs. Last Month |
|---|---|---|---|
| The services sector is likely to continue growing strongly in the near term, powered by domestic demand, rising incomes, improving consumer confidence, and continued export demand. | 63 | -5.5% | +1.4% |
| Industrial Sector Performance 👍 | Latest Month | Vs. Last Year | Vs. Last Month |
|---|---|---|---|
| Given the current high PMI, there is likely to be continued growth in the manufacturing part of the industrial sector. New orders remain strong, so many manufacturers will likely ramp up production. The momentum is favourable. | 55 | -7.2% | -8.1% |
| Agriculture Output 👍 | Latest Month | Vs. Last Year | Vs. Last Month |
|---|---|---|---|
| Given above-average rainfall, good reservoir levels, good soil moisture, and strong sowing in many key crops, the Agriculture Output Index is likely to show growth above recent years’ averages. | 51 | -1.3% | +4.5% |
| Equity Market Optimism 👎 | Latest Month | Vs. Last Year | Vs. Last Month |
|---|---|---|---|
| Market participants are advised to watch global macroeconomic indicators, such as US inflation data, Fed policy decisions, crude oil prices, and geopolitical developments that could affect risk appetite. | 49 | -62.1% | -13.2% |
| Global Economic Impact 👎 | Latest Month | Vs. Last Year | Vs. Last Month |
|---|---|---|---|
| Persistent global uncertainties, including inflationary pressures in advanced economies, shifts in US Fed policies, and geopolitical tensions, could impact capital flows and trade balances, requiring vigilant policy response. | 56 | +0.0% | -0.3% |
| Financial Sector Soundness 👍 | Latest Month | Vs. Last Year | Vs. Last Month |
|---|---|---|---|
| The financial sector is forecast to maintain its soundness, with banks’ and NBFCs’ strong buffers and healthy balance sheets supporting credit supply and risk absorption in the near term. | 68 | -9.5% | +2.0% |
| Consumer Inflation Index 👍 | Latest Month | Vs. Last Year | Vs. Last Month |
|---|---|---|---|
| Inflation is expected to remain within RBI’s target range, averaging around 3.7% during FY26, supported by continuing GST rate reforms and stable supply conditions. | 53.5 | +3.1% | +2.8% |
*Data as of August 2025, hence growth comparisons are for August 2024 for Y-o-Y and July 2025 for M-o-M growth comparison.
Where Does This Lead Us?
- Expect long-term bond yields to remain elevated. The US Fed's decision to remain accommodative will be the biggest driver of FII outflows.
- Short- to medium-term yields, however, could benefit from the RBI’s monetary stimulus, with an expected repo rate cut of 25 bps by March 2026.
- Lump-sum investment in gold at current levels is not advisable, but SIP-style investing can help improve allocation while serving as a hedge against currency and trade shocks.
- Tariffs and visa fee hike have impacted several sectors badly (IT, pharma, textiles). As clarity emerges with each passing day, the real impact on these sectors becomes clear. But until these clouds of uncertainty hover, they will remain volatile and driven by daily news.
- Outside of India and the US, several opportunities exist for global diversification. Explore them here.
For advisors, this is a market to stay nimble and data-driven; balancing the long-term India story with tactical adjustments in currency exposure, sectoral allocation, and bond duration. The next few months will reward those who monitor risks as actively as they pursue opportunities.