Equity markets are flashing mixed signals, bond yields are at record highs, and while the US Fed’s rate cuts have lifted sentiment, macroeconomic uncertainty still hangs over investors. It’s exactly the kind of environment where a closer look at your portfolio’s sectoral allocations can pay off. While one should not give in to the bears of the markets, practising caution is imperative. After all, prevention is better than cure.
In this week’s newsletter, we take a look at the macro health of six major sectors: FMCG, Banking, IT, Automobile, Pharmaceuticals, and Oil & Gas. We use key indicators, valuations, and near-term sentiment to see which areas are holding strong on domestic demand and which ones are under pressure from global uncertainties.
Sector Comparison by Returns and Valuations (September 2025)
| Sector | Returns | Price to Earnings (P/E) | ||||
|---|---|---|---|---|---|---|
| Year-to-Date | 1Y | 3Y CAGR | 5Y CAGR | Current | 10Y Median | |
| FMCG | -2.9% | -15.5% | 8.0% | 13.3% | 41.5 | 42.6 |
| Banking | 8.0% | 1.9% | 12.6% | 21.3% | 15 | 16.7 |
| IT | -19.3% | -16.6% | 9.4% | 12.3% | 25.3 | 28.9 |
| Automobile | 16.7% | 0.4% | 29.0% | 28.6% | 27.7 | 32.6 |
| Pharmaceuticals | -5.5% | -4.6% | 21.1% | 13.9% | 32.2 | 33.4 |
| Oil & Gas | 4.4% | -12.0% | 13.9% | 18.0% | 11.9 | 12 |
YTD: January 1, 2025, to September 24, 2025, 1Y: September 25, 2024, to September 24, 2025, 3Y: September 26, 2022, to September 23, 2025, 5Y:
September 25, 2020, to September 24, 2025. P/E Values are as of September 24, 2025.
Source: CMIE Economic Outlook
The tables reveal a clear trend: domestic-oriented sectors such as Banking and Auto have delivered better returns, while export-oriented sectors have lagged, with IT leading the declines, followed by Pharma.
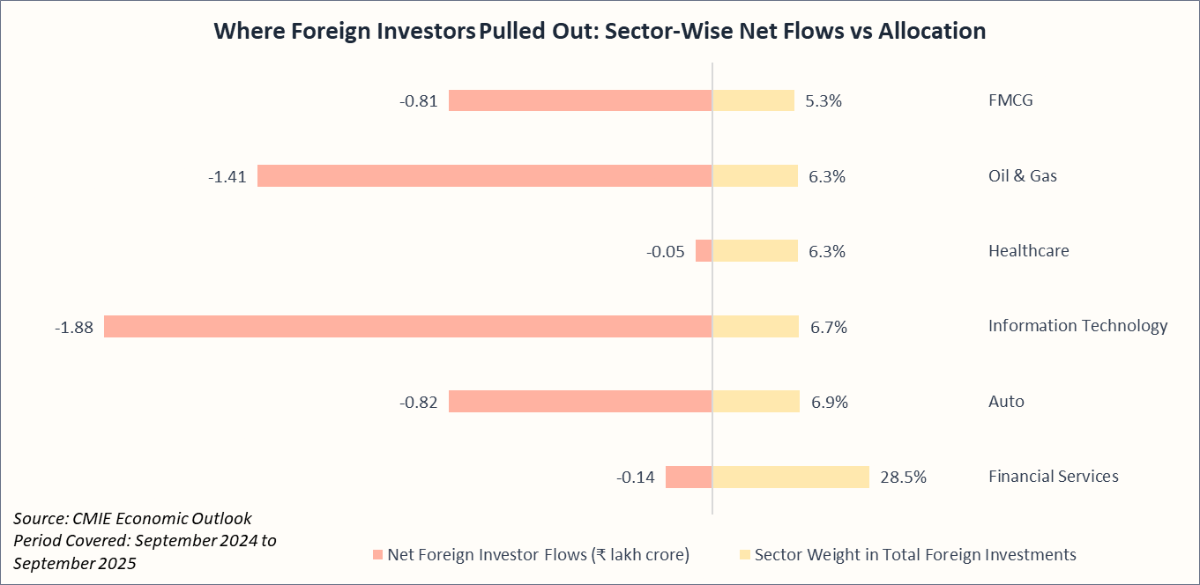
This also reflects a shift in FII strategy, as foreign investors reduce exposure to sectors vulnerable to the global demand slowdown and tariff uncertainties:
Recommended for you
Readers also explored

A Mid-Year Check: Whether India is in Flux
India's IT Sector Outlook for FY2026
Sector Specific Macro-Economic Outlook
Rural Demand, GST Boost, and Easing Inflation Strengthen FMCG Outlook
| Macro-Indicator | Latest Value | Near-Term Outlook | 6M Trend |
|---|---|---|---|
| Food Inflation | 0.05% | The GST rate cut effective 22 September 2025 is expected to meaningfully lower food and beverage inflation in the second half of FY2025-26. |  |
| Index of Industrial Production- Consumer Goods (y-o-y growth) | 0.48% | After four straight months of decline, industrial production of consumer goods has returned to growth, signalling improving production conditions. |  |
| Consumer Sentiments (y-o-y growth) | 8.22% | Consumer sentiment is expected to stay on an upward trajectory in the coming quarters, with tax cuts and GST reforms boosting disposable incomes and supporting stronger demand for both staples and discretionary FMCG products. |  |
| USD INR Exchange Rate (y-o-y growth) | -4.14% | Edible oil costs for FMCG firms are likely to stay elevated despite duty cuts, as high import dependence combined with a weak rupee keeps near-term input cost pressure high. |  |
Values as of August 2025.
Except for the Index of Industrial Production (IIP), which covers February to July 2025, all other indicators reflect March to August 2025 data. Monthly closing values have been used for the USD/INR exchange rate.
Our outlook for India’s FMCG sector remains positive. Soft food inflation is easing input costs, while policy support, including GST reforms and higher tax limits from FY2025-26, is expected to revive urban consumption, which has been weakening over the past six months. Rural demand and the rapid expansion of small FMCG players should keep sector growth on track. However, rising competition from these smaller entrants could pressure the topline growth of large FMCG companies.
Cautious Optimism in Banking as Credit Growth Slows but NPAs Stay Low
| Macro-Indicator | Latest Value | Near-Term Outlook | 6M Trend |
|---|---|---|---|
| Gross Non-Performing Assets (GNPA) | 2.20% | System-wide GNPAs are at multi-year lows and should stay contained in the near term, though rising stress in unsecured retail and MSME loans warrants close monitoring. |  |
| Deposit growth (y-o-y growth) | 10.27% | Deposits are expected to maintain steady ~10% growth, with a continued shift from low-cost CASA to higher-cost term deposits. |  |
| Bank Credit (y-o-y growth) | 10.41% | Credit growth has slowed but should gradually pick up in the second half of FY2026 as rate cuts filter through and policy transmission deepens. |  |
| Net Interest Margin (NIM) | 3.10% | NIMs are likely to face pressure in the near term due to falling loan yields and a rising share of costlier term deposits, even as liquidity conditions stay supportive. |  |
Values as of June 2025.
Note: Bank credit and deposit growth are reported at a monthly frequency covering January to June 2025, while NIM and GNPA figures are reported at a quarterly frequency from March 2024 to June 2025.
Our medium-term view on the Indian banking sector is cautiously optimistic. The full impact of recent rate cuts hasn’t yet played out, and we expect to see those benefits in the coming quarters. The main pressure point for banks is profitability, with cheaper CASA deposits shrinking and making it harder to access low-cost funds. Credit growth is also slowing, adding a demand headwind. On the positive side, falling NPAs and ample market liquidity indicate stronger balance sheets, providing banks with room to remain robust despite profitability challenges.
IT Sector Outlook Turns Negative with Weak Demand and Hiring Slowdown
| Macro-Indicator | Latest Value | Near-Term Outlook | 6M Trend |
|---|---|---|---|
| USD INR Exchange Rate | ₹ 87.52/$ | With continued FII outflows and a wider current-account gap, the rupee bias remains weak; a softer INR will lift INR-denominated IT revenues but add hedging costs. |  |
| US ISM Services PMI | 50.1 | The US ISM Services PMI is likely to remain stable to slightly soft, signalling cautious spending by US clients and a drag on Indian IT exports. |  |
| Employed Persons Growth: IT&ITES (y-o-y growth) | 9.1 | Hiring will remain cautious and selective in FY2026, with large fresher intakes on hold but GCCs and niche digital roles (AI, cloud, cybersecurity) providing bright spots. |  |
Values as of August 2025.
Note: All indicators reflect the period from March to August 2025.
Our outlook for India’s IT sector in FY2026 is negative. Earnings remain under pressure, hiring has slowed, and foreign investors are pulling back as global demand stays weak. While there are bright spots (weak rupee, a strong deal pipeline, steady ER&D export growth, and the rise of GCCs), the key challenge of converting these wins into revenues remains. For investors, the sector in 2026 should be less about near-term profits and more about positioning for the larger digital shift ahead.
Auto Sector Outlook Remains Positive with Festive and Rural Demand Tailwinds
| Macro-Indicators | Latest Value (y-o-y growth) | Near-Term Outlook | 6M Trend |
|---|---|---|---|
| Passenger Vehicle (PV) Volume Sales | 1.29% | Festive demand, potential GST cuts and cheaper credit could reignite PV sales. Volumes are likely to pick up in the second half of FY26. |  |
| Commercial Vehicle Volume Sales | 0.97% | Mining and construction activity typically rises after the monsoon. Together with stronger rural demand, CV sales volumes are expected to rise. |  |
| Tractor Volume Sales | 24.63% | With the stricter TREM V emission norms kicking in from April 1, 2026, many farmers and fleet operators are likely to advance their purchases to avoid higher costs or uncertainty. Combined with a good monsoon, this pre-buying could give tractor sales a short-term lift in the latter part of FY26. However, once the new norms are in place, demand is expected to normalise and growth may turn flat over the longer term. |  |
| Auto-components Exports | 12.69% | Over 22% of India’s auto-component exports go to the U.S., and the new 50% tariff could cut production by about 8%. This leaves Indian exporters at a clear disadvantage compared with Asian peers who face only 15 to 30% duties. |  |
Note: Passenger vehicle data reflect March–August 2025; export data cover February–July 2025; and commercial vehicle figures are reported at a quarterly frequency from March 2024 to June 2025.
Festive demand, consumption-friendly policies, and a post-monsoon surge in construction and mining indicate a strong near-term outlook for the auto sector, particularly for passenger vehicles (PVs) and tractors. However, there is a flip side. Blocked GST credits from the cess removal threaten supplier margins, and the rapid rollout of 20% ethanol-blended petrol has sparked concerns over mileage and vehicle wear. So even though demand looks strong, the supply side remains uncertain, and the long-term outlook is cautious until clarity emerges on cess refunds and ethanol adaptation.
Pharma Sector Outlook Remains Positive with Export Dominance and Policy Support
| Macro-Indicator | Latest Value (y-o-y growth) | Near-Term Outlook | 6M Trend |
|---|---|---|---|
| Pharmaceutical Exports | 6.94% | India’s pharma exports have been resilient, growing ~9% in FY 2024-25 despite global regulatory and logistical headwinds. |  |
| USD–INR Exchange (y-o-y growth) | -4.14% | The rupee’s slide from ₹85.95 to ₹88.78/$ so far, in 2025, has boosted Indian pharma’s export earnings and FX gains, though higher API import costs are trimming margins. Analysts see the currency staying weak but range-bound at ₹87–₹89, which should keep supporting exporters if companies manage input costs and hedge volatility. |  |
| Index of Industrial Production (IIP) – Pharmaceuticals | 3.65% | Industrial production in pharmaceuticals has seen stable growth, supported by domestic demand and export orders. |  |
| Raw Material Imports | 1.27% | Imports, especially of key starting materials (APIs/KSMs), remain a vulnerability, but efforts under the PLI scheme and localisation push should gradually reduce dependence. |  |
Values as of August 2025 (IIP as of July 2025).
Note: All indicators reflect the period March to August 2025, except the Index of Industrial Production (IIP), which covers February-July 2025.
Our outlook on the Indian pharma sector remains positive on the back of export dominance, strong regulatory support for local manufacturing, and resilient domestic demand. While tariffs remain an uncertainty and reliance on Chinese APIs persists, these are likely to cause only short-term margin pressures rather than derail the sector’s long-term growth story.
Oil & Gas Sector Outlook Stays Cautious Despite Strong Domestic Demand
| Macro Factor | Latest Value | Near-Term Outlook | 6M Trend |
|---|---|---|---|
| Crude Oil Prices (Indian Basket) | $69.2/barrel | Global oversupply from OPEC is keeping Brent soft near $70–$75/bbl despite Middle East tensions. Softer prices should give India near-term import cost relief, though volatility remains a risk. |  |
| Crude Oil Processed by Indian Refineries (Throughput) (y-o-y growth) | 3.21% | Refinery capacity use is high at 103% but monsoon quarters typically bring a temporary dip due to maintenance and logistics. Throughput should recover post-monsoon as transport fuel demand rebounds. |  |
| Rupee vs Dollar Rate (Import Cost Sensitivity) | ₹ 88.78/$ | The rupee has already slid about 5.8% in the last year, due to tariff tensions, dollar strength, and global uncertainties. With tariff tensions unresolved and the trade deficit widening, analysts see risks of further depreciation toward ₹89.5/$ by mid-2026 despite RBI interventions, leaving sentiment on the currency weak and cautious. |  |
| Domestic Natural Gas Output (Monthly Production Volumes) (y-o-y growth) | -2.70% | Demand for natural gas is growing fast (10% annually), but domestic production continues to slide, leaving imports at ~50% of consumption. No major new fields in FY26 mean output stays flat and import dependence persists in the near term. |  |
Values as of August 2025 (crude oil processed as of July 2025).
Note: All indicators reflect the period March to August 2025, except crude oil processed (throughput), which covers February to July 2025.
Our outlook for the Indian oil and gas sector is cautious. Domestic demand remains strong and crude oil prices are supportive, but India is caught in a geopolitical energy crunch. While the government has so far stayed its course on energy policy despite external pressure, its long-term impact remains uncertain. At the same time, India is stepping up domestic production and exploring new oil fields, a step in the right direction, though the benefits of these efforts will take time to materialise.
Summary
| Sector | Sentiment |
|---|---|
| FMCG | Optimistic |
| Pharmaceuticals | Optimistic |
| Banking | Cautiously Optimistic |
| Automobile | Cautiously Optimistic |
| Oil & Gas | Cautious |
| Information Technology (IT) | Negative |
India’s six major sectors present a mixed picture. Domestically driven areas such as FMCG, Banking, and Automobiles are benefiting from policy support, stable demand, and festive tailwinds, while export-oriented sectors like IT and Oil & Gas face pressures from weak global demand and geopolitical challenges. Clearly, it's time to turn to our domestic economy for stability and growth rather than global markets.