
Are you wondering how India managed to deliver such a strong GDP growth number? Or perhaps you’re curious about what these figures actually mean for the economy, investors, and the road ahead?
This edition breaks down the Q1 FY'26 growth numbers in detail—highlighting which sectors truly drove the momentum, and which ones raise more questions than answers.
It also addresses a key puzzle: despite landmark reforms and rate cuts, why has investor confidence remained muted? Beyond that, the outlook for India’s debt and equity markets is also covered.
Not All Sectors Are Sharing the Growth Story
Before we get to the puzzling part, let’s start with the good news. India’s Real GDP for Q1FY26 came in at a strong 7.8%—well above expectations. Services and Manufacturing led the momentum. The table below breaks down sector-wise performance, along with a brief overview of each.
| Quarter Ended | Q1 FY26 | Overview | |
|---|---|---|---|
| Nominal GDP | 8.8% | Nominal lags real growth | |
| Real GDP | 7.8% | 5-qtr high, stronger than expected | |
| Real GVA | 7.6% | Led by Services | |
| Agriculture, forestry & fishing | 3.7% | Below Forecast | |
| Industry | 6.3% | Driven Mainly by Manufacturing | |
| -3.1% | Sharp Contraction | |
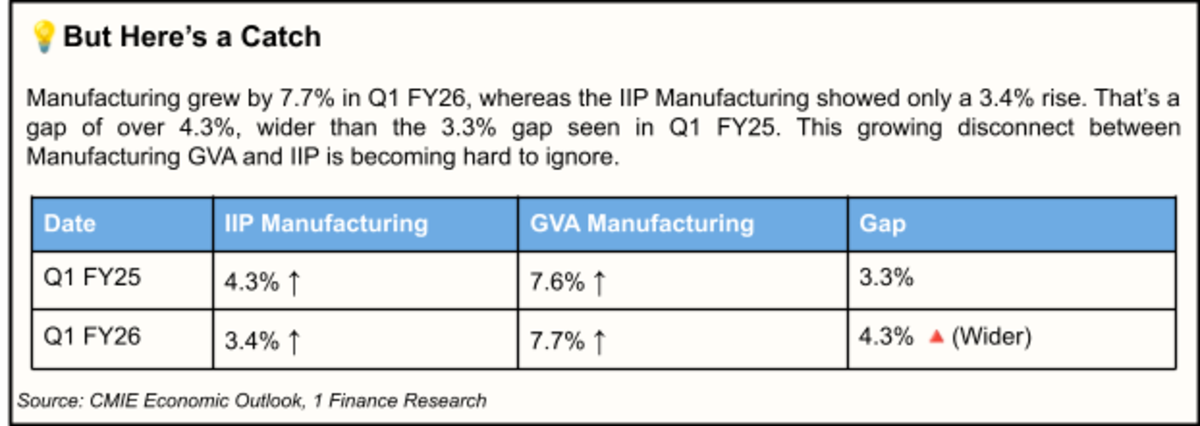
| 7.7% | Surprise Jump vs. IIP | |
| 0.5% | Flat | |
| 7.6% | Matches steel & cement demand | |
| Services | 9.3% | 8-qtr high | |
| 8.6% | Doesn’t tally with HFIs | |
| 9.5% | Strong | |
| 9.8% | Fastest | |
Numbers That Make Sense
Some growth numbers add up well. Financial and real estate grew 9.5%, while public administration, defence, and other services surged 9.8%(a 12-quarter high), reflecting higher health-education spending by public and private sources. Agriculture slowed to 3.7% on weaker wheat output. Construction rose 7.6%, in line with steel and cement trends. The Industrial sector grew by 6.3% driven by manufacturing.
Recommended for you
Readers also explored

Growth Momentum Moderates Amid Economic Shifts

India's IT Sector Outlook for FY2026
Numbers That Don’t Add Up
Despite a reported 8.6% growth in Trade and Transport Services, several indicators point to a softer underlying momentum. High-frequency indicators like GST collections, air cargo and road transport show clear moderation. For instance, sales of retail & wholesale trading firms grew only 5% in Q1 FY26, compared with 13% in Q1 FY25. The chart below highlights these weaker trends, which do not align with the strong growth reported in the sector.
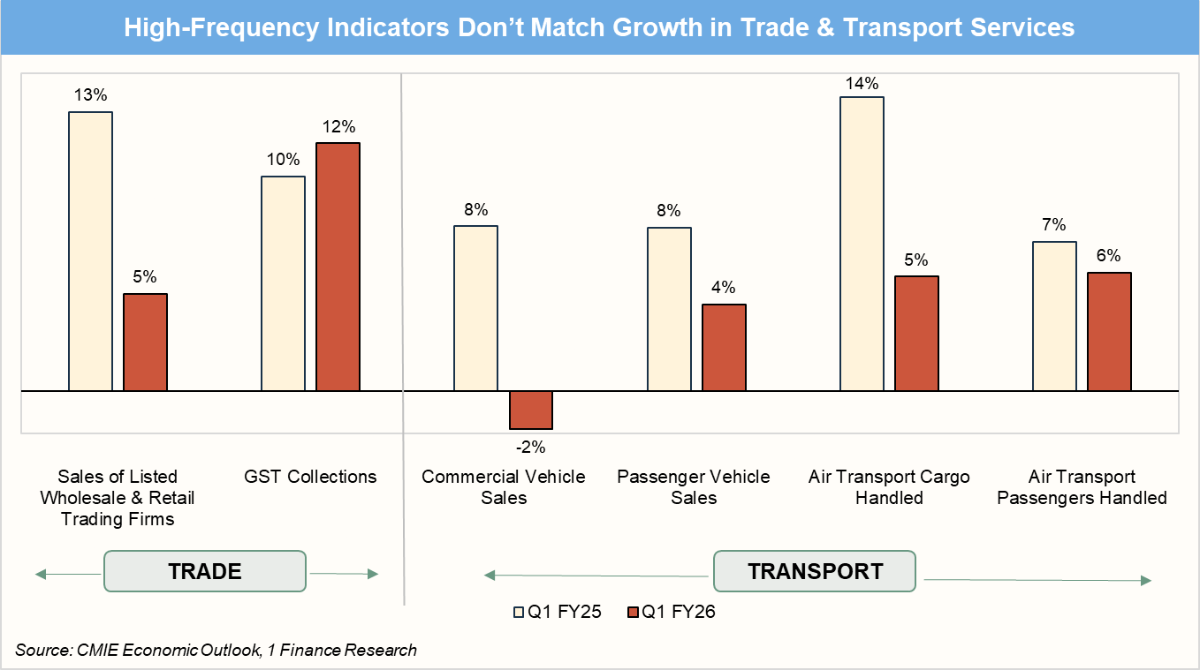
While the overall GST collections print appears strong, month-wise collections were uneven. GST collections in Jun-25 witnessed only a marginal y-o-y increase.
Lastly, the GDP deflator played a crucial role. In Q1 FY26, it fell sharply to around 0.9% from 3.1% in Q4 FY25, creating a rare gap: real GDP surged 7.8%, while nominal growth lagged at 8.8%! The sharp fall in the deflator came mainly from disinflation in wholesale prices (WPI) and base effects.
High Growth, Rate Cuts, Reforms… Then Why Aren’t Investors Excited?
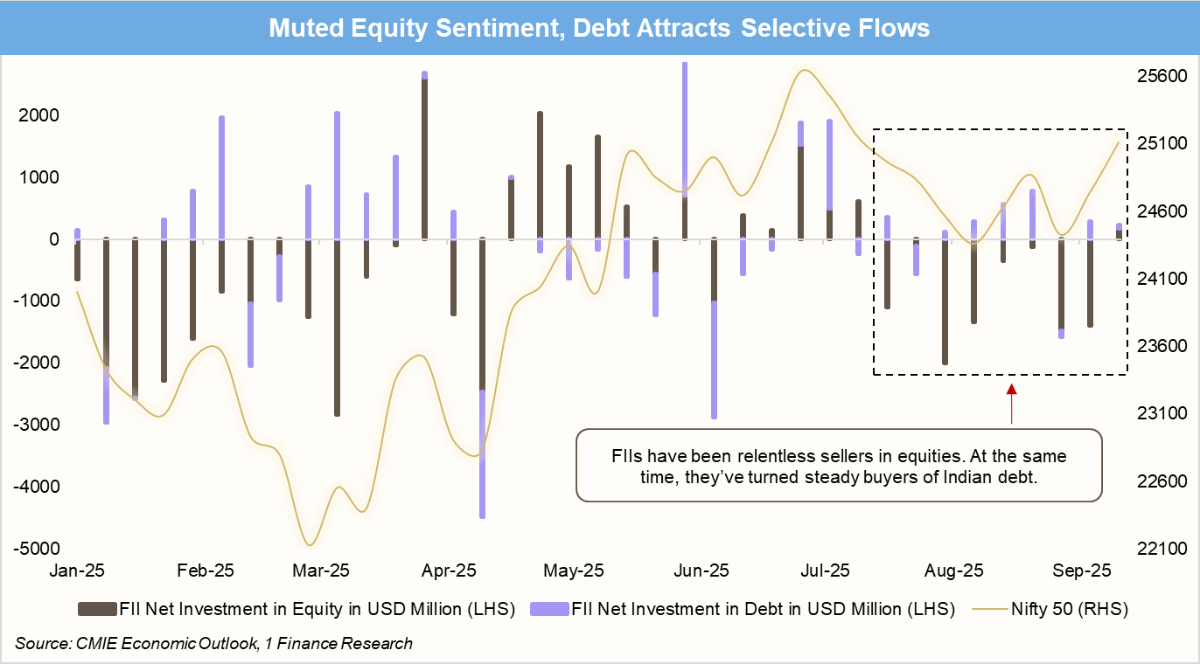
Despite several reforms, FIIs remain reluctant to commit to Indian equities. While the pace of selling has eased, it hasn’t reversed into strong buying. The drag? Tariff uncertainties, weak rupee, and stretched valuations. Instead, since Aug-25, they’ve been net debt buyers almost every week.
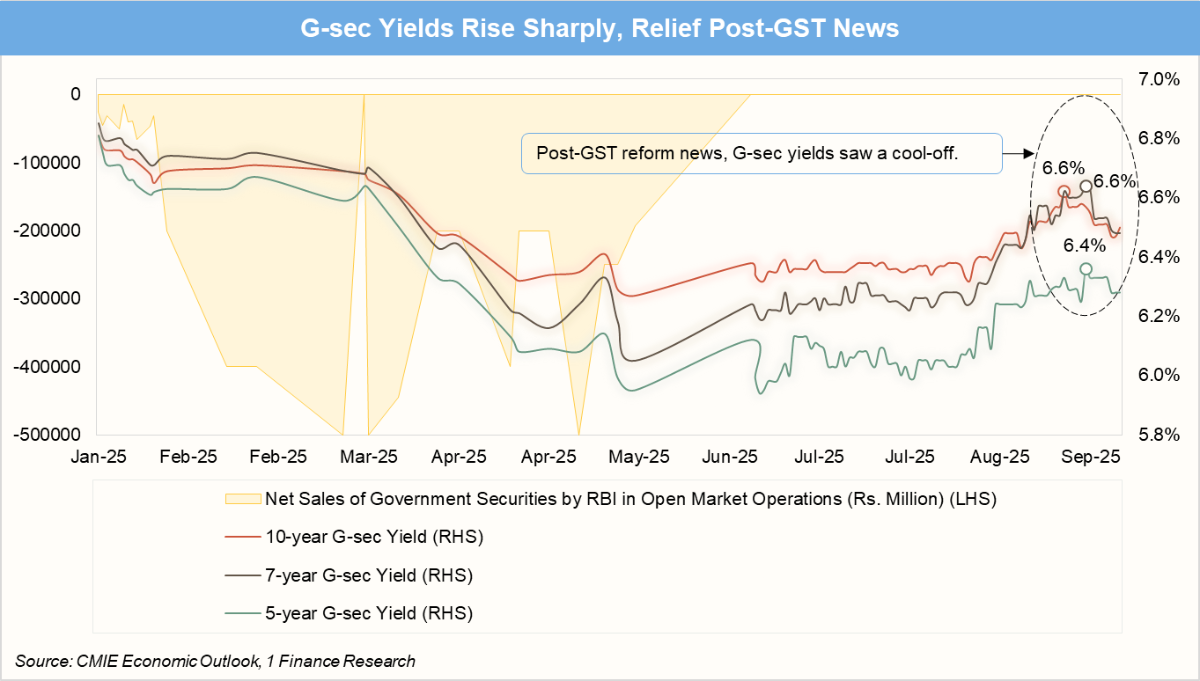
Now, let’s turn to the debt markets. Despite the rate cut cycle that began in Feb-25, G-sec yields surged sharply, with the 10-year yield spiking to 6.6% on 25th Aug 2025. Yields eased only after clarity emerged on GST rate cuts, which had initially fueled concerns over anticipated wider fiscal deficit and higher government borrowing. The Ministry of Finance estimates the revenue loss from these cuts at ₹48,000 crore.
So why did G-sec yields rise? Investors were encouraged after S&P’s rating upgrade, but that confidence faded quickly. PM Modi’s GST rate cut plan raised fresh concerns about revenues and the fiscal deficit. Add slower nominal GDP growth, tariff risks, and weak demand from banks and insurers for Gsecs. With the RBI pausing Open Market Operations (OMOs), the market had to absorb extra supply on its own, driving yields higher. Relief came only once clarity on the fiscal math eased concerns.
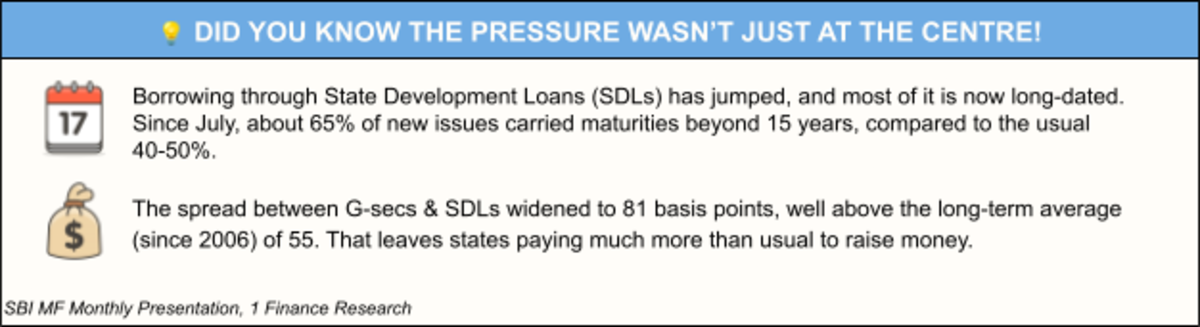
This means that states borrowed more, borrowed longer, and paid much higher spreads.
What Should Advisors Watch?
Debt
- CPI inflation remains grounded at ~2.1% YoY in Aug ’25 (up from ~1.6% in Jul), well within RBI’s comfort zone.
- Domestic supportive factors: sub-target inflation, soft growth, and liquidity surplus—must be balanced against external risks (tariffs).
- Past rate cuts and terminal rate expectations will shape yield direction; focus on short- to medium-duration debt.
- Fiscal deficit is measured as a % of nominal GDP. If nominal growth remains weak, the government’s 4.4% FY26 fiscal target becomes harder to achieve, increasing pressure on debt markets and borrowing costs.
Equities
- Don’t chase GDP headlines; focus on earnings visibility. Stimulus and macro support may lift growth, but sustained high earnings require a nominal GDP near 11-12%.
- US rate cuts could encourage equity inflows into emerging markets, including India.
- Earnings slowdown is expected to reverse going forward as the impact of rate cuts and fiscal stimulus (direct/GST tax cuts) materialises.
- Tariff uncertainty is a near-term overhang; resolution can improve sentiment and FII flows. Stay invested in Indian equities.
Conclusion
India’s growth story remains intact, but investors must separate signals from noise. Sector divergences, fiscal risks, and tariff uncertainty matter more than headline “Real GDP”. For now, a disciplined asset allocation is the best way to ride growth while staying prepared for volatility. Yes, tariff uncertainty remains a near-term drag, but its resolution could revive foreign flows and sentiment. Strong retail participation, RBI support, and GST rationalisation are setting the stage for better consumption and earnings. India remains among the fastest-growing economies, with ongoing reforms creating long-term wealth opportunities.