Introduction
What is Fiscal Deficit?
Fiscal deficit is the gap between what the government spends and what it earns through taxes and other revenues in a given year. If the government spends more than it collects, it borrows money to cover that shortfall - the gap is called the fiscal deficit.
Think of it like your own budget. Suppose you earn ₹6 lakh a year but spend ₹8 lakh. The extra ₹2 lakh you need? You either borrow it or dip into savings. That’s your personal “fiscal deficit.” For governments, the numbers are much bigger, but the logic is the same.
The Fiscal Deficit Formula
Economists measure it with a straightforward formula:
Fiscal Deficit = Total Government Expenditure - (Revenue Receipts + Non-debt Capital Receipts)
where,
Total Government Expenditure = Money that the government spends in a year (eg, infrastructure projects, salaries, subsidies, etc).
Revenue Receipts = Money that the government earns without selling any assets (eg, taxes, dividends, fees, etc).
Non-debt Capital Receipts = Money from selling assets or recovering old loans (eg, selling stake in PSU like LIC, etc).
What’s Next?
Now that the basics are clear, let’s dig deeper: looking at India and global fiscal deficits, the factors driving them, how they shape the economy and credit ratings, and most importantly, what it means for your finances.
Historical & Current Fiscal Deficit (%GDP) of India
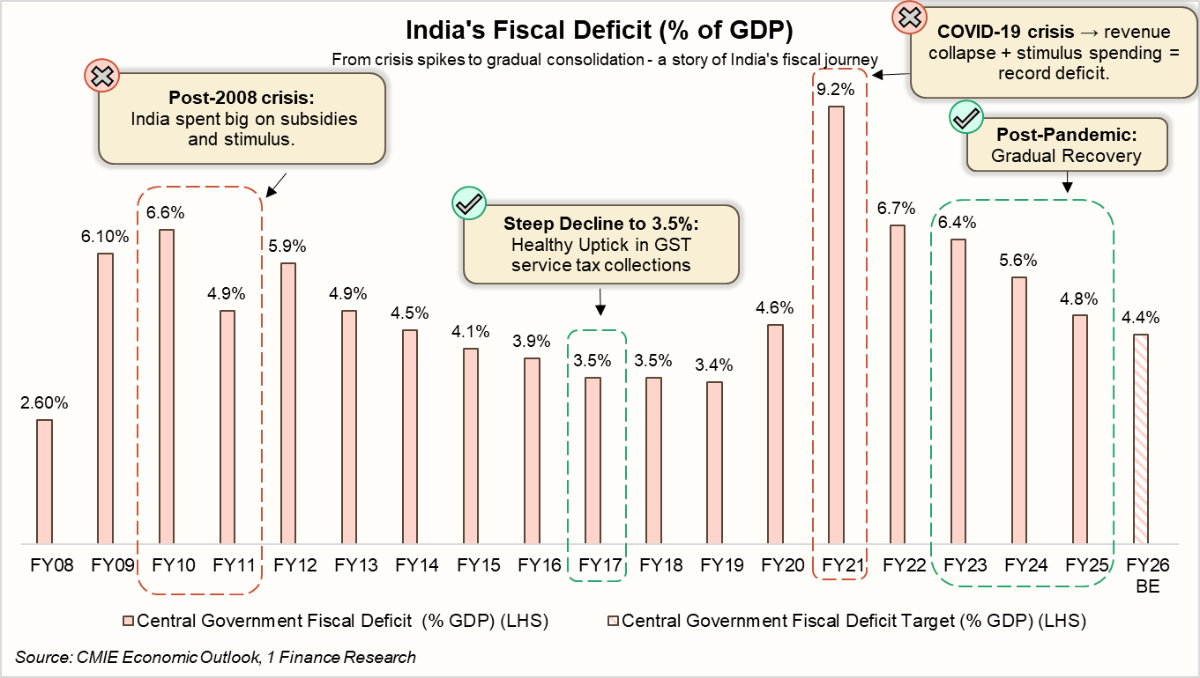
Let’s see the reality. India’s fiscal deficit typically remains around 3-5% of GDP, but it increases after crises, such as over 6% in FY10-11 post the global financial crisis, or 9.2% in FY21 at the COVID-19 peak. Since then, it has been narrowing down to 4.8% in FY25, with a target of 4.4% in FY26. To keep the fiscal discipline in check, India had introduced the FRBM Act back in 2003. It sets limits on deficits (3% of GDP), mandates transparency, and aims to anchor debt at sustainable levels. While targets were pushed back during crises, the Act remains the backbone of India’s fiscal framework.
Recommended for you
Readers also explored

Index of Industrial Production: What Is It and How Does It Affect You?

World GDP Breakdown 2025: Who Powers the Global Economy?
Why Fiscal Deficits Rise and Fall: A Practical Look
Ever wondered why a government’s fiscal deficit sometimes increases sharply and at other times declines? The deficit responds to economic conditions and policy choices, rising when spending surges or revenues fall, and contracting when growth and collections strengthen. Let’s explore the main drivers with some real-world examples.
- Government Spending Priorities
Large-scale spending can significantly widen deficits, especially during emergencies. Take India during COVID: free food, vaccines, and rural employment schemes pushed the fiscal deficit from 4.6% of GDP in FY20 to 9.2% in FY21, the highest in decades. (∴ Government Spending ↑, Deficit ↑) - Oil & Commodity Prices
For countries that rely heavily on commodities, fluctuations in global oil prices can have a significant impact on their budgets. Saudi Arabia experienced this in 2020: collapsing oil demand reduced revenues by 20%, causing the deficit to surge to 11.2% of GDP. (∴ Low oil prices hurt exporters, while high prices strain importers) - Tax Revenues & Collections
Deficits can also be reduced through effective revenue measures. Estonia in 2009 faced a sharp downturn and implemented higher VAT, social security contributions, and excise taxes while trimming expenditures. This combination of stronger collections and controlled spending helped restore fiscal balance quickly. - Borrowing Costs & Interest Burden
Debt obligations contribute directly to deficits. In the U.S. today, rising interest rates and high debt levels mean that interest payments alone are projected to reach 3.2% of GDP by 2026, increasing further to 4.1% by 2035. Higher borrowing costs can become a major driver of fiscal deficits even without additional spending. (∴ Borrowing Costs ↑, Deficit ↑) - Economic Growth Rate
Economic growth is a key factor in narrowing deficits. China’s post-2008 stimulus illustrates this: its ¥4 trillion ($586 bn) package widened the deficit to -2.8% of GDP in 2009, but robust 10.6% growth in 2010 boosted revenues and reduced the gap to -0.1% by 2011. When the economy expands, higher revenues help offset large expenditures. (∴ Economic Growth ↑, Deficit ↓)
Is Fiscal Deficit Good or Bad?
To answer that, we first need to understand the difference between fiscal deficit, surplus and balanced budget:
| Parameter | Fiscal Deficit | Fiscal Surplus | Balanced Budget |
|---|---|---|---|
| Definition | The fiscal deficit occurs when a government’s total expenditure exceeds its total revenue (excluding borrowings) in a given fiscal year. | A fiscal surplus arises when a government’s total revenue (excluding borrowings) exceeds its total expenditure in a fiscal year. | A balanced budget is achieved when a government’s total revenue (excluding borrowings) equals its total expenditure in a fiscal year. |
| Meaning | Spending > Revenue | Spending < Revenue | Spending = Revenue |
| Why it Happens | Emergencies, stimulus, big projects. | Conservative spending, high collections. | Careful planning to match income & spending. |
| How It’s Financed | Borrowing (domestic/external) or printing money. | Extra revenue saved or invested. | No borrowing or extra savings required. |
| Impact | It can boost growth in downturns, but increases debt. | Reduces debt, shows fiscal discipline, may slow growth. | Stable finances |
Fiscal deficit isn’t good or bad by itself; it can support growth if used productively, but requires careful debt management. Fiscal surplus, on the other hand, signals discipline and creates fiscal space, but may limit growth stimulus if overdone. A balanced budget provides stability and predictability, but reduces flexibility in responding to shocks or funding large investments.
Global Comparison of General Government Fiscal Balance (% GDP)
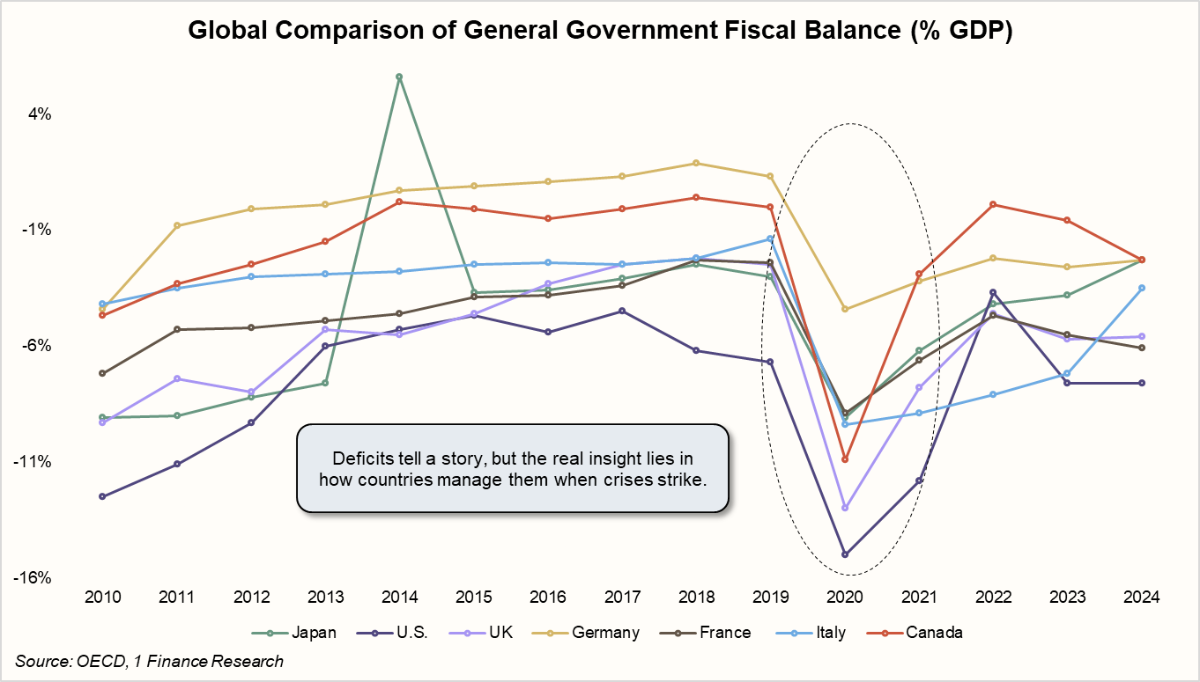
Let’s look at the global perspective of how fiscal deficits have evolved. One thing becomes very clear: fiscal rules bend when crises strike. In 2020, every major economy saw deficits balloon as governments stepped in to protect households and businesses. Even the most disciplined countries abandoned targets. The lesson is simple: fiscal rules work in normal times, but crises always come first.
Another insight is that fiscal space depends on past choices. Germany and Canada had stronger balance sheets going into COVID, so they could spend freely without rattling markets. The UK and France, already carrying higher deficits, didn’t have the same luxury. Pre-crisis prudence is what creates room to manoeuvre when shocks hit.
How Fiscal Health Drives Sovereign Ratings
Fiscal deficit and debt-to-GDP are two of the biggest drivers of a country’s credit rating. Rating agencies track them closely as signals of fiscal health. A high and rising debt-to-GDP ratio raises doubts about repayment, especially if growth isn’t strong enough to keep up. Temporary deficits, like during COVID, are usually tolerated. But chronic overspending is seen as a bigger risk.
That’s why downgrades often come when rising debt meets weak fiscal credibility, as seen when Moody’s downgraded U.S. sovereign debt in 2025. Europe offered a stark reminder too: Greece and Italy’s unchecked debt in the 2010s triggered crises, bailouts, and painful austerity. In simple terms, the higher the debt and deficit, the greater the refinancing risk, and the sharper the spotlight from rating agencies.
Fiscal Deficit and Its Effect on Portfolios and Household Finances
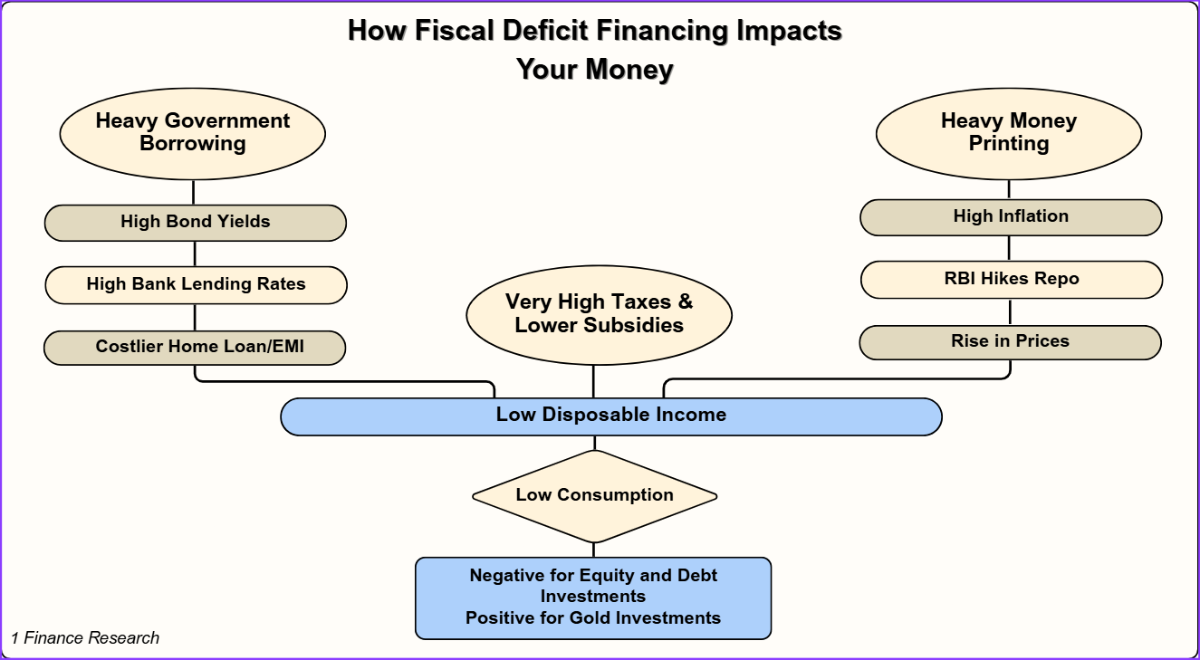
Fiscal deficit isn’t just an accounting gap; it shapes interest rates, inflation, and investor returns. How it’s financed matters, because it can either support growth or erode wealth. The impact may not be immediate, but it gradually reflects in portfolios and daily finances. The chart below shows how each financing choice plays out. For instance, money printing may cover the gap, but it sparks inflation. Higher inflation cuts disposable income, pushes the RBI to raise rates, slows consumption, hurts debt and equities, while gold gains as a safe haven.
Conclusion
The fiscal deficit, when managed wisely, can serve as a powerful lever for growth. Investments in infrastructure, tourism, healthcare, and manufacturing not only create jobs but also enhance long-term productivity, generating revenues that help narrow the deficit over time. However, fiscal space is not limitless. Repeated loan waivers, unchecked subsidies, or politically driven giveaways may provide short-term relief but ultimately weaken fiscal health, crowd out private investment, and strain future taxpayers.


