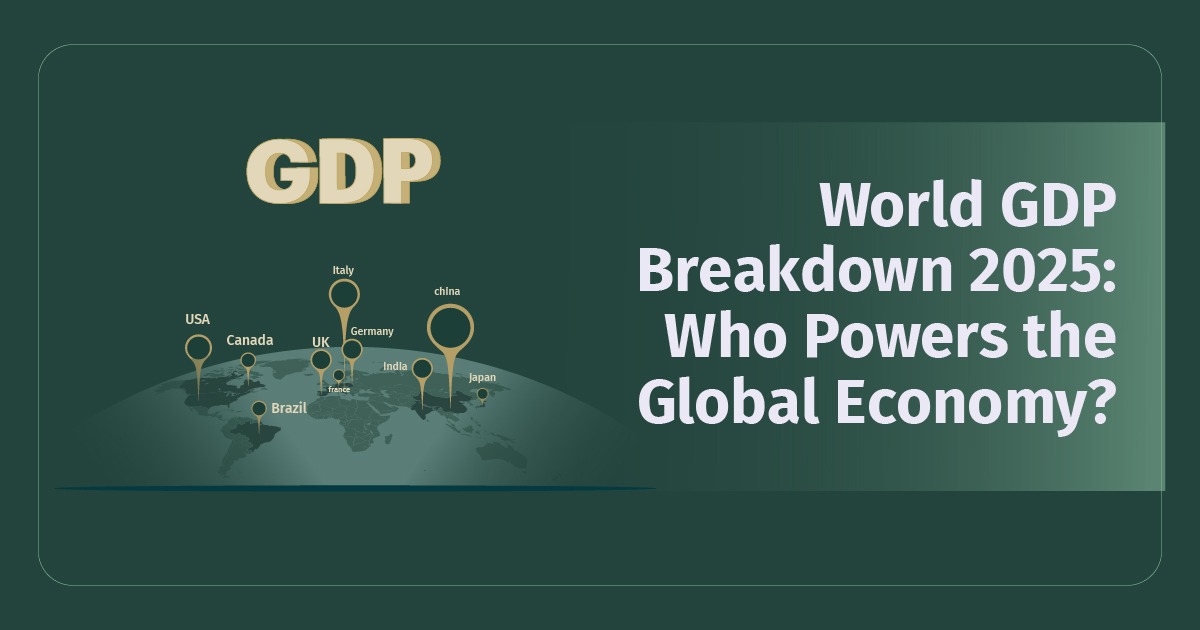
Ever wondered who truly drives the gears of the global economy? Beyond the headlines of overall economic growth lies a fascinating and crucial story: the World GDP breakdown. This isn't just about a single, colossal number; it's about understanding how that massive economic pie is sliced, revealing which nations, regions, and groups are the primary contributors to the world's wealth.
As of mid-2025, the global economic landscape remains in a state of dynamic evolution. The International Monetary Fund (IMF) projects the World's Nominal GDP to reach approximately $113.8 trillion in 2025. This staggering figure is the sum of every country's economic output, reflecting the collective productivity, innovation, and consumption patterns across the globe. But who holds the biggest pieces of this pie, and how are their contributions shaping the future of global power?
In an increasingly interconnected world, understanding World GDP isn't just for economists or policymakers; it’s crucial for anyone seeking to grasp the forces shaping our shared future.
The Big Picture: Global GDP in 2025
Before we zoom out to the global picture, let’s first grasp the fundamental concept of GDP itself. Gross Domestic Product (GDP) measures the total market value of all final goods and services produced within a country in a given period. When aggregated globally, it becomes a powerful metric for understanding the scale and distribution of economic activity.
As of mid-2025, the global economic landscape continues to be dominated by a few major players, but the proportions are dynamically shifting. Based on the latest nominal GDP forecasts from leading international bodies like the IMF (updated in April 2025), we can paint a clear picture of the World GDP breakup.
The overall World Nominal GDP for 2025, according to the IMF’s April 2025 World Economic Outlook, is projected to be around $113.8 trillion. This colossal sum is not evenly distributed.
The Global Economic Divide: Advanced vs. Emerging Economies
The IMF categorises the world's economies into two primary analytical groups, which broadly reflect their stage of economic development and income levels: Advanced Economies and Emerging Market and Developing Economies (EMDEs). This initial breakdown provides a high-level view of the global economic structure.
For 2025, the IMF projects the following distribution:
| Analytical Group | Nominal GDP (Trillion USD) - 2025 (Projected) | Real GDP Growth Rate (%) - 2025 (Projected) | GDP Per Capita - 2025 (Projected) | % Share of World GDP (2025) |
|---|---|---|---|---|
| Advanced Economies | 66.87 | 1.4% | $60,320 | 58.76% |
| Emerging Markets and Developing Economies | 46.93 | 3.7% | $6,800 | 41.24% |
| World Total | 113.8 | 2.8% | $14,210 | 100% |
It is very evident that Advanced Economies still command the majority share of World GDP. These nations, typically characterised by high-income levels, developed infrastructure, and mature industrial and service sectors, represent nearly 60% of the global economic output. However, their projected growth rate of 1.4% is significantly lower than that of EMDEs.
Conversely, Emerging Market and Developing Economies, while holding a smaller overall share, are the engines of faster global growth, with a collective Real GDP growth rate of 3.7%. This dynamic highlights the ongoing trend of economic power gradually shifting towards the developing world, driven by factors like industrialisation, rising populations, and increasing integration into global trade.
However, the GDP per capita figures starkly reveal the profound disparity between these two groups. In 2025, the GDP per capita in Advanced Economies is projected to be a substantial $60,320. For EMDEs, this figure stands at a much lower $6,800. This means that, on average, individuals in Advanced Economies generate nearly 9 times more economic output than those in EMDEs, underscoring the deep economic divide in living standards and productivity across the globe.
Recommended for you
Readers also explored

August 2025 MPC Review: Calm Now, But Global Storms Brewing
Currency in Circulation: How Much Money Exists in the World?
Regional Contributions: Where Global GDP is Concentrated
The IMF further breaks down the global economy into specific geographic and economic regions. This regional view provides more granularity, showing which parts of the world are leading the charge in economic contribution and growth.
Here's the World GDP breakdown by region for 2025, using the IMF's classifications:
| Region (IMF Classification) | Nominal GDP (Trillion USD) - 2025 (Projected) | Real GDP Growth Rate (%) - 2025 (Projected) | % Share of World GDP (2025) |
|---|---|---|---|
| Advanced Economies (Sub-Regions) | 66.87 | 1.4% | 58.76% |
| United States | 30.51 | 1.8% | 26.81% |
| Euro Area | 16.82 | 0.8% | 14.78% |
| Japan | 4.19 | 0.6% | 3.68% |
| United Kingdom | 3.84 | - | 3.37% |
| Canada | 2.23 | - | 1.95% |
| Other Advanced Economies | 9.28 | 1.6%* | 8.15% |
| Emerging Market and Developing Economies (Sub-Regions) | 46.93 | 3.7% | 41.24% |
| Emerging & Developing Asia | 27.67 | 4.5% | 24.31% |
| Emerging & Developing Europe | 5.74 | 2.1% | 5.10% |
| Latin America & Caribbean | 6.68 | 2.0% | 5.86% |
| Middle East & Central Asia | 4.94 | 3.0% | 4.34% |
| Sub-Saharan Africa | 1.90 | 3.8% | 1.67% |
Source: IMF, 1 Finance Research
The Giants of Global GDP: Top 10 Economies in the World
Zooming in further, the global GDP can be further broken down for individual countries. Examining the top economies offers a precise view of who comprises the largest slices of the World GDP pie in 2025.
GDP forecast or estimate (Million US$) by Country
| Rank | Country | Nominal GDP (Trillion USD)- 2025 (Projected) | Real GDP Growth Rate (%)(Projected) | GDP Per Capita - 2025 (Projected) | % Share of World GDP (2025) | |
|---|---|---|---|---|---|---|
| Forecast | 2025 | 2026 | ||||
| 1 | United States of America | 30.51 | 1.8% | 1.7% | $89,110 | 26.81% |
| 2 | China | 19.23 | 4.0% | 4.0% | $13,690 | 16.89% |
| 3 | Germany | 4.74 | 0.0% | 0.9% | $55,910 | $55,910 |
| 4 | India | 4.19 | 6.2% | 6.3% | $2,880 | 3.68% |
| 5 | Japan | 4.19 | 0.6% | 0.6% | $33,960 | 3.68% |
| 6 | United Kingdom | 3.84 | 1.1% | 1.4% | $54,950 | 3.37% |
| 7 | France | 3.21 | 0.6% | 1.0% | $46,790 | 2.82% |
| 8 | Italy | 2.42 | 0.4% | 0.8% | $41,090 | 2.12% |
| 9 | Canada | 2.23 | 1.4% | 1.6% | $53,560 | 1.95% |
| 10 | Brazil | 2.13 | 2.0% | 2.0% | $9,960 | 1.87% |
Key Country Insights:
- Together, the United States and China are projected to account for a massive 43.7% of the world's Nominal GDP in 2025. This highlights their unparalleled economic dominance and their critical role in shaping global economic trends. While the U.S. boasts an exceptional GDP per capita of $89,110, China's $13,690 reflects its vast population despite its massive total output.
- Germany maintains its position as the third-largest economy globally, showcasing its substantial accumulated wealth and industrial capacity. Despite a projected flat Real GDP growth rate of 0.0% in 2025, its high GDP per capita of $55,910 underscores its strong economic foundation and productivity, with a modest recovery expected in 2026.
- India is a standout performer, projected to be the fastest-growing major economy at 6.2%. Its rapidly expanding economic output means it's on the cusp of becoming the fourth-largest economy, potentially surpassing Japan in 2025. This represents a significant shift in the global GDP breakdown. However, India's GDP per capita remains comparatively low at $2,880, highlighting vast development potential and the scale of its population.
- Traditional economic powerhouses like Japan, the UK, France, Italy, and Canada remain among the top contributors, though their shares of World GDP are notably smaller than those of the US and China.
Implications of the World GDP Breakdown for 2025
The World GDP breakdown for 2025 is not just a collection of numbers; it's a blueprint of global economic power and a predictor of future trends.
- The increasing share of EMDEs, particularly in Asia, signals a continued shift in economic influence from the West to the East. This has profound implications for global trade agreements, investment flows, and multilateral cooperation.
- The significant difference in growth rates between advanced economies and EMDEs means the "pie" isn't just being re-sliced; the faster-growing pieces are expanding disproportionately. This creates both opportunities for economic development and the potential for greater income inequality between nations.
- Despite ongoing geopolitical tensions, inflationary pressures, and supply chain disruptions, the global economy continues to grow. The breakdown shows that resilience is distributed unevenly, with some regions acting as stabilisers while others face significant headwinds.
The World GDP breakdown for 2025 paints a picture of a global economy in transition. While traditional economic powerhouses retain significant shares, the rapid growth and increasing contributions from emerging economies are fundamentally reshaping the landscape. Monitoring these shifts is key to understanding the complex forces that will define our shared economic future.
