What is Portfolio Reward to Risk Ratio?
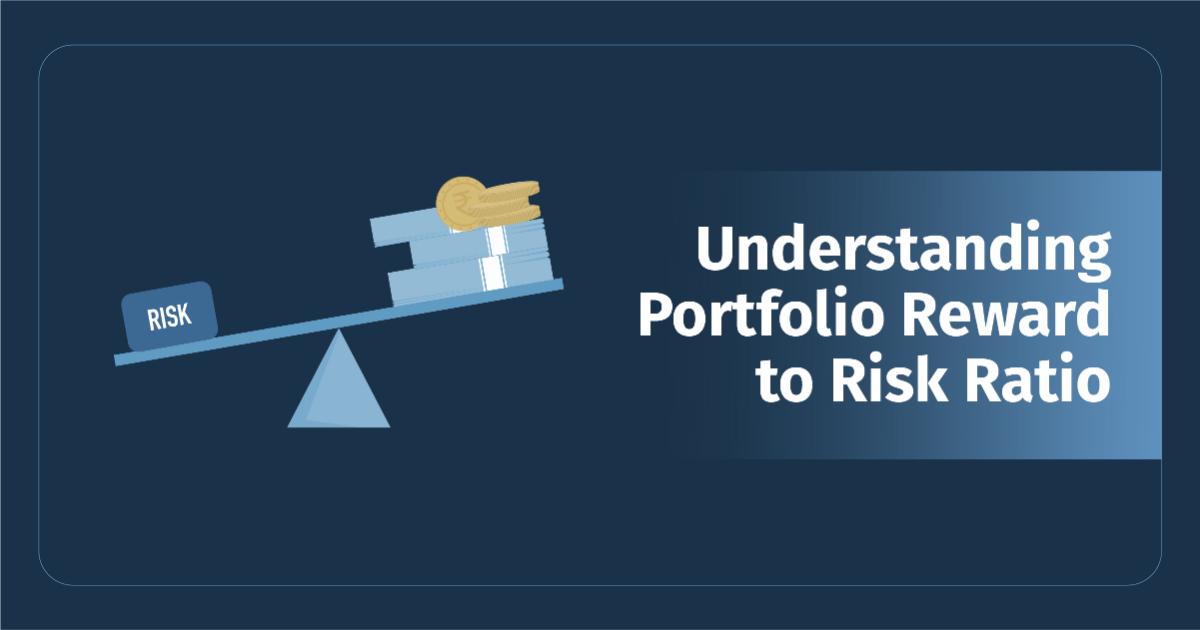
Portfolio Reward to Risk Ratio (R:R) measures the return an investor can expect for each unit of risk taken. It can be calculated for individual asset classes or an entire portfolio.
The ratio is typically calculated using the mean annual return and the annualised standard deviation. However, other measures of return and risk can also be used.
For example: a R:R of 2.1x indicates that for every unit of risk assumed, the investor can expect 2.1 units of return.
Key to Smarter Investing
Why can't my portfolio just make high returns with zero risk? This is a question that reflects the human desire for guaranteed gains without facing any uncertainty. However, the reality of investing is that risk is an inherent part of the process.
Understanding and managing risk is crucial for achieving long-term investment success. This is where portfolio reward to risk ratio comes into play. But before getting into the technicalities around the reward to risk ratio, let us first understand the basics of risk and return.
Risk and Return Basics
| Concept | Explanation | Example |
| Investment Risk | The possibility that your investment will not generate the return you expected, or that you may lose some or all of your initial investment. | Imagine you lend a friend ₹5000. There's a risk they might not pay you back, right? That's similar to investment risk. You're hoping for a return (getting your ₹5000 back, maybe with interest), but there's a chance you won't. |
| Investment Return | The gain or loss on an investment. It can be in the form of income (like dividends or interest) or capital appreciation (increase in the value of the asset). | If you buy a stock for ₹100 and sell it for ₹120, your return is ₹20 (or 20%). If you receive ₹5 in dividend payments while holding the stock, that's also part of your return. |
Types of Investment Risks
Systematic Risk: Systematic risk affects the entire market and cannot be diversified away. Examples include changes in interest rates, inflation, recessions, or major global events.
Unsystematic Risk: Unsystematic risk, also known as company-specific or asset-specific risk, affects individual companies or assets and can be reduced through diversification.
How Risks and Returns Are Connected
In general, higher potential returns come with higher risk. This is called the risk-return trade-off. Investors need to decide how much risk they're willing to take to achieve their desired level of return.
Recommended for you
Readers also explored
Using Risk-Return Scatter Plots for Portfolio Optimisation

Currency in Circulation: How Much Money Exists in the World?
Risk-Adjusted Return
The reward to risk ratio is founded on the fundamental principles of risk-adjusted return. To truly optimise a portfolio, it is essential to evaluate performance relative to the risks assumed. This metric also helps us better compare different investment opportunities and available asset classes.
Without such tools, those who take on more risk might appear to be better performers simply because they are exposed to greater potential gains, not necessarily because they are better at managing investments.
Since there are a wide range of asset classes to choose from, it is vital that their performance be evaluated in a way that reflects the risk taken. A higher reward-to-risk ratio indicates better performance than a higher reward alone.
Using Portfolio Reward to Risk Ratio (R:R)
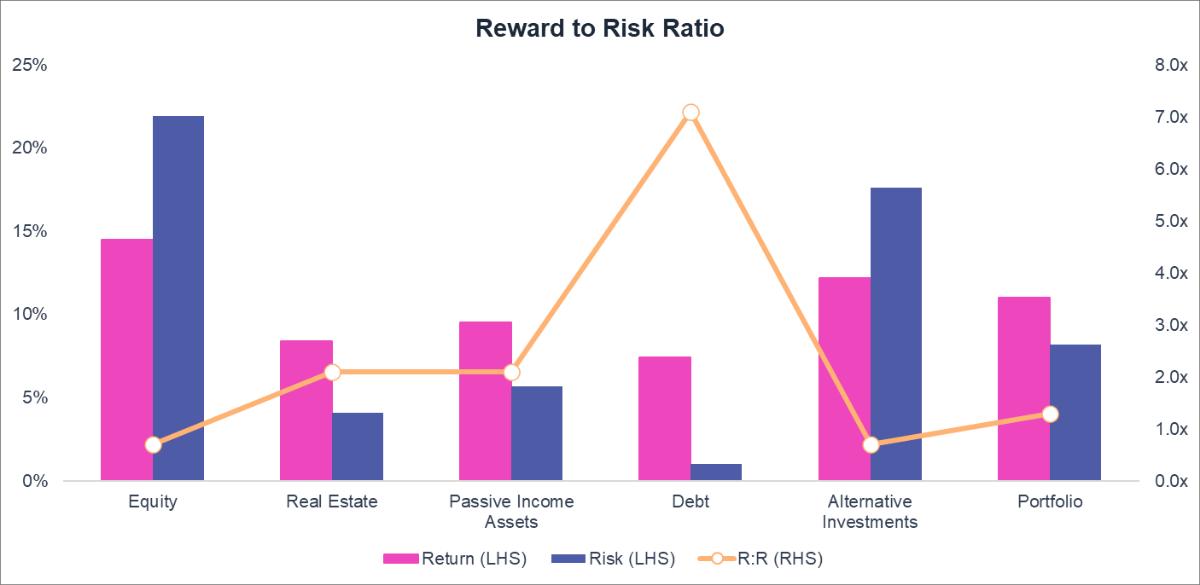
The chart above visually represents the reward to risk ratio for a person in the building phase of their life (ages 26-35). Let's begin by understanding the fundamentals of interpreting this chart.
How to interpret the Reward to Risk Ratio?
- Equity has a return of 14.50% and the risk is 21.90%. This means the R:R ratio is 0.7x. So for every unit of risk taken in Equity, the investor can expect to receive 0.7 units of return.
- Real Estate offers a more favorable R:R ratio of 2.1x, indicating that for every unit of risk, the investor can expect to receive 2.1 units of return.
- Passive Income Assets show an R:R ratio of 1.7x.
- Debt exhibits a significantly higher R:R ratio of 7.1x.
- Alternative Investments have an R:R ratio of 0.7x.
- A portfolio is a collection of financial assets such as stocks, bonds, commodities, cash, and other investments, strategically allocated to achieve specific financial goals while managing risk. The portfolio, with an R:R ratio of 1.3x, demonstrates a more balanced reward - risk profile compared to some individual asset classes.
The Math Behind Reward to Risk Ratio
The risk-return table provides a detailed breakdown of the estimated return and risk associated with each asset class, as well as the overall portfolio.
Major considerations for building the Reward to Risk Ratio:
1. Asset Classes
Equity
The NIFTY 500 index was selected as a proxy for the Indian equity market due to its broad representation of publicly traded companies. Daily closing prices were used for return calculations.
Real Estate
It involves direct ownership of property. Property investments that are non-yielding - made either to occupy or to benefit from capital appreciation. As the industry progresses, we can indirectly invest in the form of Real Estate Investment Trusts (REITs).
Passive Income Asset
Investments that generate a regular stream of income with little to no active involvement. This asset class has no primary stream that generates secondary income. A few examples of Passive Income Assets are income from rental property, income generated from renting out a car, etc.
Debt
An index representing the daily returns of a diversified selection of three debt mutual funds, covering a significant portion of the debt market spectrum, was created. Data was obtained from ACE MF.
Alternative Investments
Daily price data for Gold UTI ETF was sourced from ACE MF to represent the performance of gold as an alternative investment.
2. Returns and Risks
Returns of asset classes are typically presented as annualised percentages, reflecting the expected gain over a one-year period. Risk is quantified using standard deviation, a measure of the dispersion of returns around the mean.
3. Age Group
Our tool helps you find the right asset allocation strategy by considering different age ranges. It's important to remember that your investment portfolio optimisation strategy needs to change as you age.
| Below 35 years | |
| Goals and Requirements | This phase marks the early career stage, where individuals focus on skill acquisition and career development. Financial goals typically revolve around achieving independence and establishing a solid financial foundation. |
| Diversification Strategy | This age allows for a greater allocation towards growth-oriented assets like equities, with a focus on long-term capital appreciation. |
| 36-45 years | |
| Goals and Requirements | As individuals progress in their careers and income levels rise, they may encounter increased financial responsibilities, such as supporting a family or caring for aging parents. |
| Diversification Strategy | While still maintaining a growth-oriented mindset, investors in this phase may seek a balance between growth and stability. This could translate into a diversified portfolio with a mix of equities, real estate, and passive income assets to generate both capital appreciation and steady income streams. |
| 46-55 years | |
| Goals and Requirements | This phase often represents peak earning years, with individuals potentially assuming leadership roles and enjoying greater financial stability. With retirement on the horizon, the focus may shift towards preserving wealth and generating income for future needs. |
| Diversification Strategy | A more conservative asset allocation, emphasising stable income-generating assets like bonds and dividend-paying stocks, may be appropriate at this stage. |
| Above 55 years | |
| Goals and Requirements | Individuals at this age are either retired or actively planning for it. For those already retired, financial goals may shift towards pursuing personal interests and prioritising health. For those still planning, the focus may be on maximising retirement savings, ensuring adequate insurance coverage, and establishing estate plans. |
| Diversification Strategy | A conservative approach to asset allocation, prioritising capital preservation and income generation, becomes increasingly important. |
4. Macroeconomic Phases
The following macroeconomic phases can significantly influence investment opportunities and risk profiles. The economy goes through several macroeconomic phases, namely, Growth, Strong Recovery, Weak Recovery, Transitory Slowdown, Sharp Slowdown, and Recession.
The Growth phase is characterised by:
- Economic Expansion
- Robust GDP Growth
- Low Unemployment
- Rising Corporate Profits
The Strong Recovery phase is characterised by:
- Robust Rebound in Economic Activity
- High Consumer and Business Confidence
- Increased Spending and Investment
- The economy may still be operating below its full potential.
- An example of a strong recovery phase in India would be the period between Oct-20 to Sept-22, the post-pandemic recovery driven by stimulus measures and pent-up demand.
The Weak Recovery phase is characterised by:
- Sluggish Rebound in Economic Activity
- Subdued Consumer and Business Confidence
- Lower Investment Enthusiasm
- Weak recovery occurs when initial policy reforms start stabilising the economy, but structural adjustments keep growth modest.
The Transitory Slowdown phase is characterised by:
- Temporary Deceleration in Economic Growth
- Moderate Pace of Economic Growth
- Rising Interest Rates
- Supply Chain Disruptions
- An example of a transitory slowdown in India would be the 2008 global financial crisis and the GST and demonetisation impact in 2016-2017.
The Sharp Slowdown phase is characterised by:
- Rapid and Significant Deceleration of Economic Activity
- Global Economic Weakness
- Geopolitical Tensions
- Financial Market Instability
- An example of a sharp slowdown in India would be the period of Jun-91 to Sep-91, triggered by the 1991 balance of payments crisis, leading to high inflation, fiscal deficits, and sluggish growth.
The Recession phase is characterised by:
- Economic Contraction
- Declining GDP
- Rising Unemployment
- Falling Corporate Profits
- Pessimistic Investor Sentiment
- High Risk Aversion
- Technically, India has never experienced a recession.
The Role of Reward to Risk Ratio in The Asset Allocator
The reward to risk ratio played a pivotal role in the development of the Asset Allocator, guiding its functionality across various stages:
Security Selection:
The reward to risk ratio was employed to meticulously analyse individual securities within each asset class (equity, debt, alternate investments, passive income assets, and real estate) in the Indian market. This analysis enabled the identification of securities that offered the most favourable balance between potential return and associated risk, ensuring that only the most efficient securities were considered for inclusion in the model portfolios.
Portfolio Construction:
The reward to risk ratio is used as a guiding principle in determining the optimal asset allocation for different life-stage investors and macroeconomic phases. By considering the historical and expected reward to risk ratios of various asset classes, the Asset allocator constructs diversified portfolios that aim to maximise returns while optimally managing risk.
By systematically incorporating the reward to risk ratio into its core functionalities, the Asset Allocator strives to provide investors with a data-driven and insightful approach to portfolio management, fostering a balance between growth and stability in the dynamic Indian financial market.
Practical Fixes
The examples provided below are for illustrative purposes only and should not be considered investment recommendations. They are intended to demonstrate how one can make use of the reward to risk ratio more effectively. Investing involves risk, and it is essential to conduct your own thorough research and consult with a qualified financial advisor before making any investment decisions.
Using the Reward to Risk Ratio to Make Better Portfolio Allocation Decisions:
| Example 1 | |
| Scenario | Revised Scenario |
Investor A’s portfolio strategy
“Investor A's investment approach is influenced by cognitive biases, particularly a tendency to overemphasise potential rewards while underestimating risks. He's drawn to the high return offered by equity and doesn't fully appreciate the potential for losses. This results in a low reward to risk ratio, indicating that he's not being adequately compensated for the level of risk he's taking on.” | What could Investor A do differently?
“This diversified approach lowers the overall portfolio risk while still providing a respectable return. This is a significant improvement over the all-equity approach.” |
| Example 2 | |
| Scenario | Revised Scenario |
Investor B’s portfolio strategy
“Investor B is demonstrating loss aversion bias. This bias reflects a strong preference for avoiding losses, even if it means missing out on potential gains. Her focus on preserving capital and her attraction to the stability of Debt suggest a heightened sensitivity to potential losses, which is characteristic of loss aversion. While her desire for stability is understandable, it's important to consider that an overly conservative approach might hinder her ability to reach her long-term financial objectives, particularly when inflation is factored in.” | What could Investor B do differently?
“The overall portfolio risk remains low, aligning with Investor B's conservative approach, but the potential return is higher than a debt-only strategy.” |
Other Ways to Use The Reward to Risk Ratio
Also, this tool is super helpful for investors, whether you're a risk-averse type or someone who prefers aggressive investing. Just by looking at the table, you can easily see which assets fit your comfort level with risk and what kind of returns you might expect.
Asset Allocation and Reward to Risk Ratio in Volatile Markets
- It's natural to wonder if Reward to Risk Ratio and asset allocation is always effective. The key question to ask yourself is: What's the alternative? While it's true that during certain rare market events – like those times when virtually every investment type declines in value simultaneously – even a well-diversified portfolio, carefully constructed using R:R considerations, will likely experience losses.
- This doesn't mean asset allocation, or the use of R:R, has failed. Its purpose isn't to eliminate all risk of loss; rather, it aims to maximise your potential return for a specific level of risk you're willing to accept. Or, to put it another way, it seeks to minimise your risk for a target level of return.
- So, when you're weighing the value of asset allocation and R:R, remember to consider the bigger picture. Even with their imperfections, they offer a demonstrably better approach than simply picking investments without a strategic framework.
- A well-structured asset allocation strategy, incorporating R:R analysis, is the strongest foundation to build a successful portfolio.
Common Mistakes to Avoid
The reward to risk ratio provides a rational framework for investment decisions. But we're not always rational! Our emotions and biases can influence our perception of risk and reward, leading us to make choices that don't align with our long-term goals.
We're learning more and more about how our psychology affects our investing. It turns out that how we handle risk isn't always consistent. Things like how our investments have been doing lately, the overall risk in our portfolio, and what's happening in the market can all influence our decisions. And, if we could better understand these patterns, we could get even better at managing risk.
Let's look at some common behavioral biases to avoid.
Loss Aversion
Loss aversion, the tendency to feel the pain of a loss more strongly than the pleasure of an equivalent gain, can significantly impact portfolio management. Investors influenced by loss aversion may be overly cautious, missing out on potential gains, or they might hold onto losing investments for too long, hoping to avoid realising the loss (evident in our previous example of Investor B). This can lead to a portfolio that is either too conservative to meet long-term goals or one that carries excessive risk in the hope of "making up" for past losses. Understanding loss aversion can help investors make more objective decisions about when to reduce or increase the allocation of the asset class in their portfolios, ultimately leading to a more optimised reward - risk profile. Similarly watch out for Optimism Bias where we tend to be overly optimistic about the future and underestimate the likelihood of negative events (same like Investor A in our previous example).
Regret Aversion
Regret Aversion, we tend to avoid making decisions that we fear we might regret later. This can lead to inaction, such as failing to reduce exposure to losing asset class or take advantage of a new opportunity. The fear of regret can prevent necessary portfolio adjustments and negatively impact the reward to risk ratio.
Herd Mentality
Herd Mentality, we often follow the crowd, assuming that if everyone's doing something, it must be right. This can lead to chasing trends and investing in "hot" asset classes without proper research. This can inflate bubbles and create portfolios with excessive risk, lowering the overall reward to risk ratio when the trend inevitably reverses.
Conclusion
It's tempting to chase after the highest possible returns, but smart investors know that managing risk is just as crucial. It's not enough to simply look at the potential gains an investment could bring; you also need to carefully consider the potential for loss.
In fact, as we've seen, research suggests that prioritising risk management can often lead to better long-term results. A portfolio built with diversification and a focus on managing risk is more likely to deliver consistent returns over time, even if it doesn't always have the highest potential upside. This is where the reward to risk ratio becomes incredibly helpful.
By understanding and applying the reward to risk ratio, you can make more informed decisions about your investments. It allows you to quantify the trade-off between potential gains and the level of risk involved, helping you find the right balance for your individual circumstances.
