What is a Yield Spread?
A yield spread is the difference between the quoted rate of return on different debt instruments, which often have varying maturities, credit ratings, and risk. This difference is most often expressed in basis points (bps) or percentage points.
- Yield spreads are critical for understanding risk and return in fixed-income markets, providing insights into market expectations, monetary policy, and economic trends.
- They also serve as an essential indicator for macroeconomic analysis, helping market participants identify shifts in risk appetite and economic sentiment.
- Understanding yield spreads allows investors, policymakers, and analysts to make informed financial and strategic decisions.
Different Types of Yield Spread
1. Credit Spread
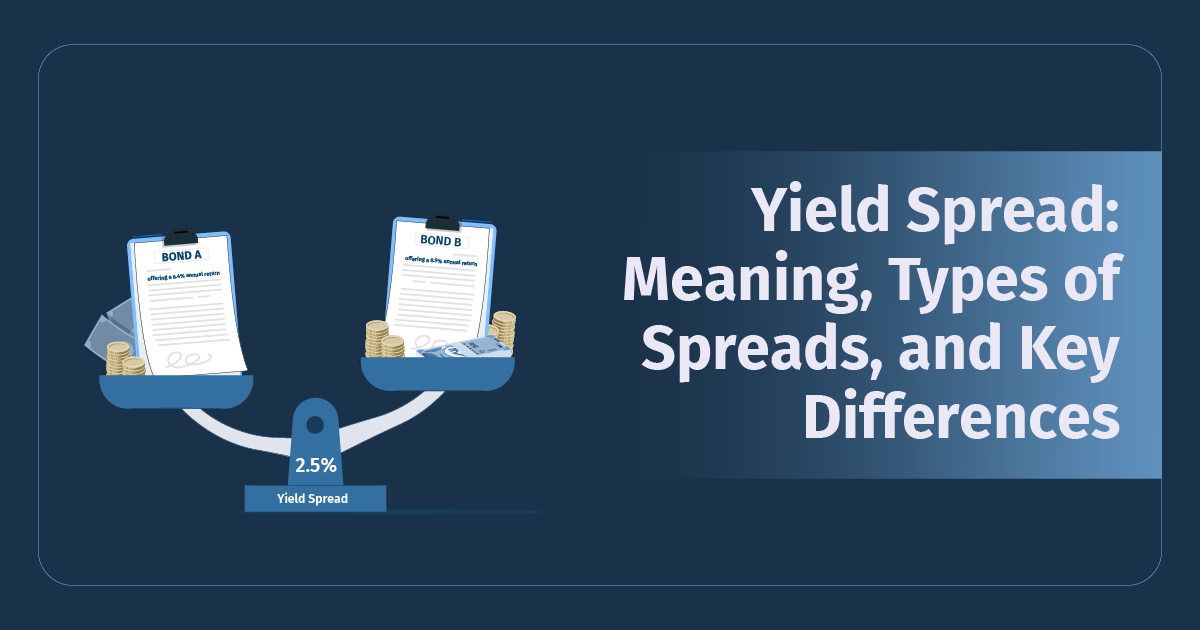
Imagine you're presented with two investment opportunities:
- Bond A: Issued by a well-established government, offering a 6.4% annual return.
- Bond B: Issued by a promising but lesser-known corporation, offering a 8.9% annual return.
While the higher yield of Bond B might seem attractive, the additional return comes with higher risk. Yield spreads quantify this difference and help investors make informed decisions.
Yield spreads reflect the premium investors require for taking on additional risk. For instance, government bonds are considered relatively risk-free due to sovereign backing, whereas corporate bonds may carry credit and default risks. The difference between their yields represents the additional compensation required to account for this uncertainty.
Yield Differences Across Security Types
| Bond Type | Yield (%) | Risk Level |
|---|---|---|
| 10-year Indian G-sec (Bond A) | 6.4% | Low |
| 10-year AA-rated Indian Corporate Bond (Bond B) | 8.9% | High |
Data as of June 27, 2025
How to Calculate Credit Spread?
- Find the yield on the corporate bond (say, a 10-year AA-rated Indian Corporate Bond)
- Find the yield on the government bond on the same maturity (10-year Indian G-sec)
- Apply Credit Spread Formula:
Credit Spread = 10-year AA-rated Indian Corporate Bond yield - 10-year Indian G-sec yield
= 8.9% - 6.4%
= 2.5% = 250 bps (1% = 100 bps)
By understanding the yield spread, investors can gauge how much additional yield compensates for the added risk. A smaller spread indicates lower risk perception, while a widening spread reflects growing concerns about economic or credit risks.
Recommended for you
Readers also explored

India’s Debt Market 2025: Key Charts & Trend Analysis

World GDP Breakdown 2025: Who Powers the Global Economy?
How Yield Spread Serves as an Indicator of Economic Conditions
Yield spreads act as barometers of economic health, revealing investor sentiment and overall risk appetite in the market. When economic uncertainty rises, investors flock to safer assets, such as government bonds, driving their yields lower. Simultaneously, yields on riskier corporate bonds rise due to declining investor confidence, widening the spread.
- Wider spreads: Indicate rising risk perceptions, credit stress, or economic downturns.
- Narrower spreads: Suggest improving economic stability, confidence, and lower default risks.
The COVID-19 pandemic in 2020 provides a vivid example of how yield spreads respond to economic crises:
a) Initial Crisis Phase:
During the early months of the pandemic, global economic uncertainty surged as lockdowns disrupted supply chains and consumer activity. This led to a sharp widening of corporate bond spreads as investors anticipated heightened credit default risks.
- Government Bonds: Witnessed a massive influx of capital, driving yields lower as central banks, like the Federal Reserve and the Reserve Bank of India (RBI), slashed interest rates to stabilise economies.
- Corporate Bonds: Yield spreads relative to government bonds widened as investors demanded higher returns to compensate for elevated risks.
b) Quantitative Easing and Policy Interventions:
- Central banks introduced large-scale asset purchase programs and fiscal stimulus packages to inject liquidity into the markets. These measures narrowed spreads over time by reducing panic and improving credit conditions.
- For instance, in India, the RBI’s accommodative policies ensured adequate liquidity, narrowing the spread between AAA-rated corporate bonds and government securities.
c) Recovery Phase:
As economies reopened and vaccines were rolled out, market confidence began to return. This led to a narrowing of spreads as investor sentiment improved.
2. Term Spread
Term spread measures the difference between the yields on long-term and short-term bonds. It primarily reflects maturity risk, inflation expectations, and interest rate dynamics. A rising term spread typically indicates positive growth expectations, while a narrowing or negative term spread (inverted yield curve) signals economic uncertainty or recession.
Investment decisions hinge on balancing risk and return based on individual financial goals, investment horizons, and market conditions. Yield spreads reflect this tradeoff: higher returns often come with higher risk.
- Short-Term Bonds: Suitable for short-term financial goals (e.g., saving for a vacation or car purchase). They carry lower yields but involve less exposure to interest rate fluctuations and credit risks.
- Long-Term Bonds: Ideal for long-term goals (e.g., retirement or home purchase). They offer higher yields but expose investors to interest rate risks and inflation over time.
Yield Differences Across Horizons
| Maturity | Yield (%) | Risk Level |
|---|---|---|
| 1-Year Indian G-sec | 5.5% | Low |
| 10-Year Indian G-Sec | 6.4% | Medium |
| 30-Year Indian G-sec | 7.1% | High |
Data as of June 25, 2025
How to Calculate Term Spread?
- Find the yield on the government bond (say, a 10-year Indian G-sec)
- Find the yield on the government bond of different maturity (1-year Indian G-sec)
- Apply Term Spread Formula:
Term Spread = 10-year Indian G-sec yield - 1-year Indian G-sec yield
= 6.4% - 5.5%
= 0.9% = 90 bps (1% = 100 bps)
Longer maturities typically involve higher yields because investors require compensation for tying up capital for extended periods. This spread is critical for making investment choices, especially during volatile economic conditions. For instance, an investor with a low risk appetite may choose short-term bonds, while one seeking higher returns may invest in longer-term corporate bonds with a higher spread.
Did You Know?
The yield curve isn’t static; it responds to different forces across maturities.
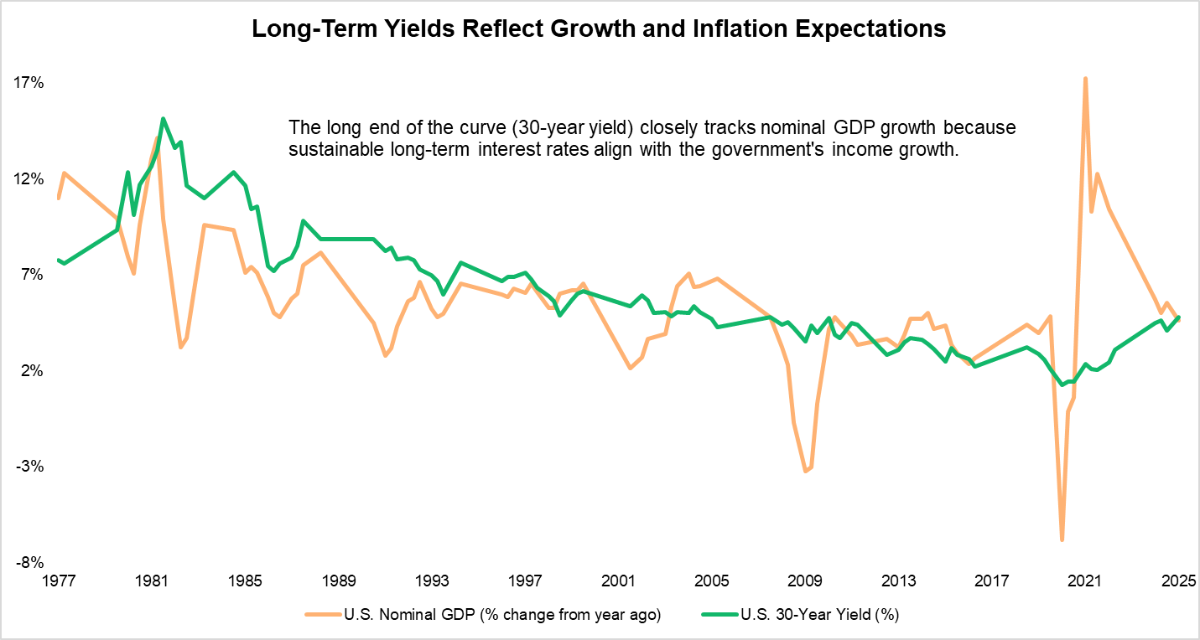
1. Long-term yields (20+ years) closely track nominal GDP growth over time because Sustainable long-term interest rates tend to align with the government’s income growth, which is linked to nominal GDP. Yields themselves are often used to predict future GDP growth, and vice versa, since both reflect expectations about inflation and economic expansion.
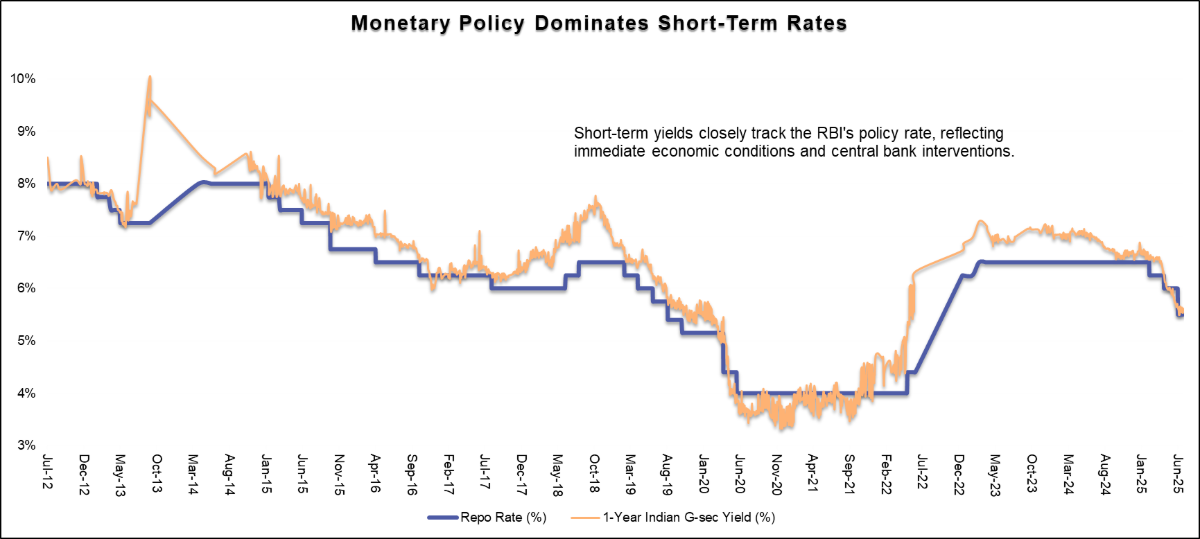
2. Short-term yields (less than 3 years), on the other hand, are primarily driven by monetary policy. Changes in the central bank’s policy rate, like the RBI’s repo rate, have a direct influence on short-term yields, reflecting near-term economic conditions.
Different Types of Yield Curve
The yield curve is a crucial graphical tool representing the relationship between bond yields and their maturities. It is a key indicator of market expectations for interest rates, inflation, and economic growth. Yield curves can take on various shapes, each offering insights into current and future economic conditions:
1. Normal Yield Curve: This is the most common shape, where long-term bond yields are higher than short-term yields, creating an upward slope. It reflects:
- Economic Growth: Investors expect higher inflation and interest rates in the future.
- Stable Conditions: Suggests a healthy, expanding economy with manageable risks.
- Key Insight: Normal curves often accompany periods of robust consumer spending and industrial growth.
2. Inverted Yield Curve: This occurs when short-term bond yields exceed long-term yields, resulting in a downward slope. It is widely recognised as a leading indicator of economic recessions.
- Economic Pessimism: Reflects investor expectations of declining future interest rates and economic slowdown.
- Historical Example: In 2006-2007, the yield curve inverted, signalling the 2008 global financial crisis.
- Implications: Banks may reduce lending as profit margins on loans shrink, slowing down economic activity.
3. Flat Yield Curve: Characterised by similar yields for short- and long-term bonds, indicating market uncertainty.
- Transitional Phase: Often observed during shifts between economic growth and contraction.
- Investor Uncertainty: Suggests unclear expectations about future interest rates and inflation.
- Key Insight: Flat curves can signal periods of monetary policy transition, such as rate hikes or cuts.
Each yield curve type provides distinct signals about market sentiment, making it an essential analytical tool for policymakers, investors, and analysts.
| Term Spread Value | Interpretation |
|---|---|
| Positive | Normal yield curve → Higher expected growth |
| Flat | Uncertainty or late-cycle slowdown |
| Negative | Inverted curve → Possible recession signal |
Predicting Recession using Yield Curve
While not flawless, an inverted yield curve, where short-term interest rates exceed long-term rates, has historically been one of the most reliable signals of an upcoming recession. It reflects investor expectations of slower growth or lower inflation, leading to increased caution among both markets and policymakers.
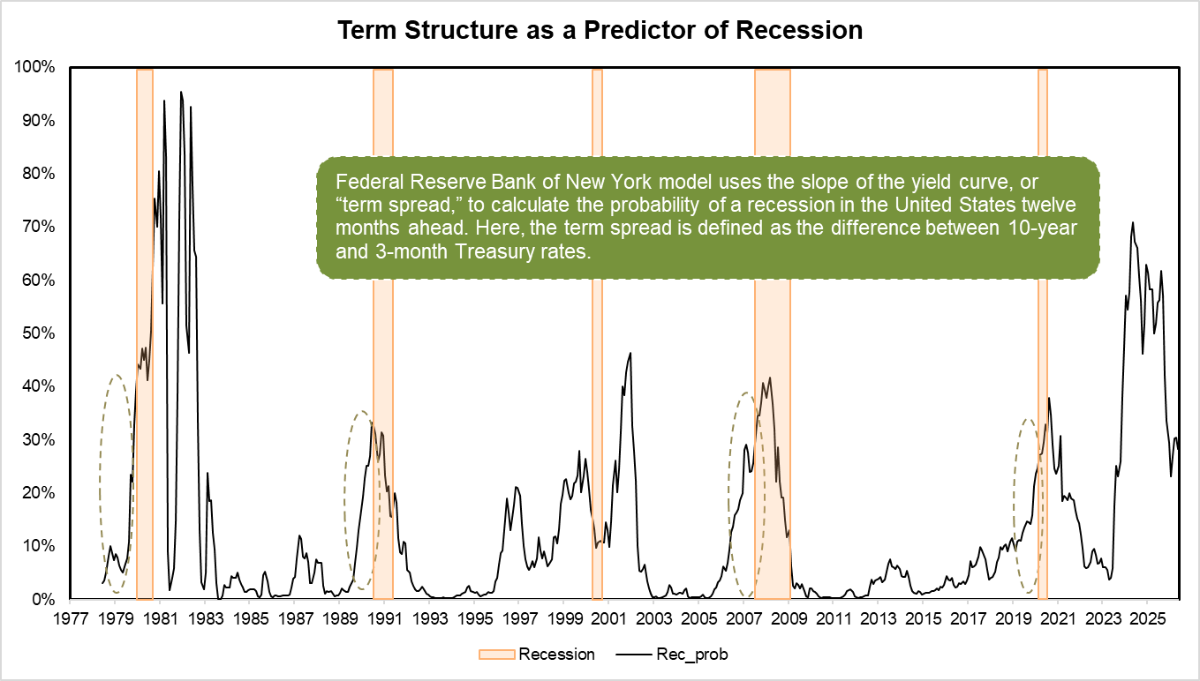
The term spread, typically measured as the difference between the 10-year and 3-month U.S. Treasury yields, is a key tool used to estimate recession probability. This relationship is long-standing, with documented evidence dating back to the 19th century. One well-known model based on this spread is the “Probability of U.S. Recession, Twelve Months Ahead”, which uses the term spread as a leading indicator.
A consistently negative term spread (inversion) tends to precede downturns by four to six quarters, reinforcing its value as an early warning signal.
Key insights:
- Inversions lasting a month or longer are more predictive than brief fluctuations.
- Even a very narrow positive spread or a flattening curve can signal a possible slowdown.
- Tracking yield curve movements, especially extended inversions, remains critical for projecting changes in the economic cycle.
Global Perspective on Yield Spread
Emerging economies like India tend to have higher credit spreads due to inflation risks, currency volatility, and economic growth expectations. By contrast, developed economies like the USA and the UK have lower spreads due to stable economic conditions.
| Country | Credit Spread (bps) | Economic Condition |
|---|---|---|
| U.S. | 40 bps | Stable |
| India | 250 bps | Growing |
Data as of June 26, 2025
Note: Credit Spread (bps) = [(10-Year G-sec yield - 10-Year AA rated Corporate Bond Yield) * 10000]
India- U.S. Yield Spread at Multi-decade Lows: Current Scenario
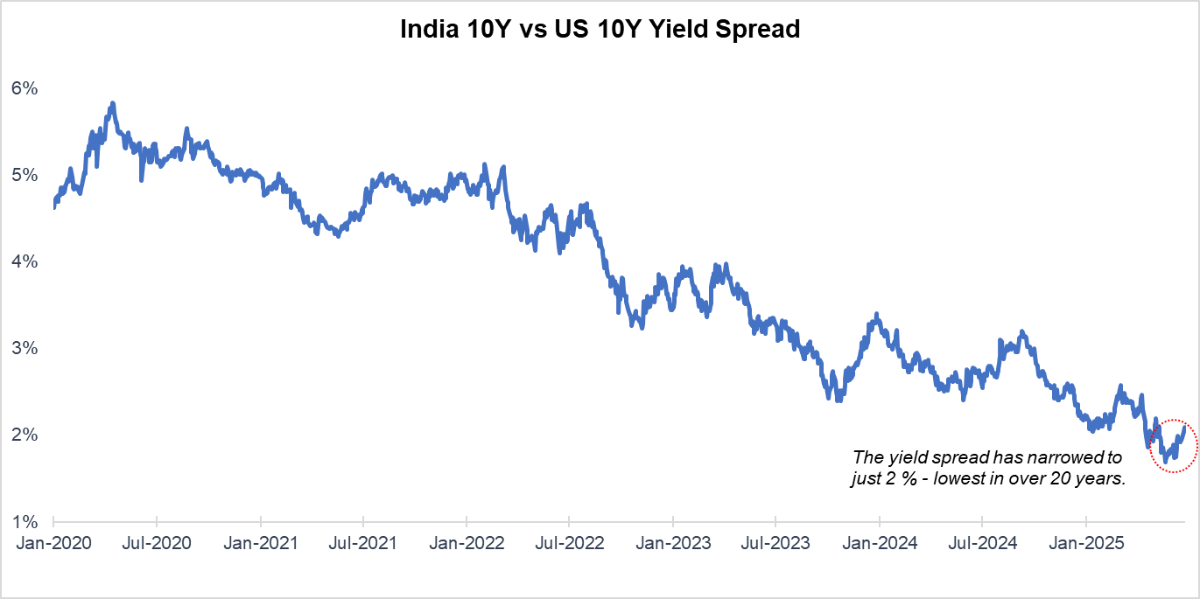
In June 2025, the India–U.S. 10-year bond spread narrowed to just 2%, reflecting India's easing rates and U.S. policy delays. While it signals macro confidence, the shrinking spread may dampen foreign appetite for Indian debt.
Domestic investors may benefit from falling yields, but risks remain. To know more, read our full debt outlook: India’s Debt Market 2025: Key Charts & Trend Analysis
Conclusion
In the complex world of financial markets, yield spreads stand out as invaluable indicators that bridge the gap between market sentiment, economic conditions, and investment strategies. From reflecting the health of the economy to influencing investor decisions, their versatility makes them a foundation of fixed income analysis.
Understanding the subtleties of yield spreads, whether it’s the term spread indicating growth expectations, credit spreads signalling risk, or yield curves predicting recessions, equips investors and policymakers with the tools to manage complexities with confidence. Historical trends and case studies, such as the COVID-19 pandemic, emphasise the predictive power of yield spreads in forecasting crises and recoveries.
As the global economy evolves, yield spreads will remain a critical measure of risk, return, and opportunity. By utilising their insights, investors can optimise their portfolios, governments can refine their policies, and analysts can interpret the story of markets. In essence, yield spreads are not just financial metrics but narratives of economic endurance and flexibility.