Emerging markets delivered their strongest relative performance in 2025, outperforming developed markets by 11 percentage points, supported by rate cuts, a weaker dollar, and renewed capital rotation. But the Strait of Hormuz escalation changed that game completely in 2026.
This edition examines how Emerging Markets have performed relative to developed markets across two decades, and identifies how the five emerging markets, South Korea, Taiwan, Brazil, China and India are positioned in 2026. We also map two plausible scenarios around what could play out in 2026, and also include some options available for Indian investors for investing in Emerging markets.
| Key Takeaways |
|---|
| Three key variables have driven Emerging Market Performance in recent years: Emerging markets outperform when there are rate cuts globally, the USD weakens, and crude oil prices remain stable or demand-driven. |
| Among major EMs, India remains well-positioned, supported by strong domestic growth. However, it retains high sensitivity to crude oil. Markets have corrected meaningfully post the US-Iran escalation, while sustained rupee depreciation continues to be a key macro risk for 2026. |
| China remains reasonably valued (PE: ~13.6x) among major markets, but structural headwinds such as weak domestic demand, real estate market stress, and geopolitical tensions continue to affect the sentiment despite relatively lower oil sensitivity. |
| Brazil offers attractive valuations (PE: ~13.3x) and is also well-positioned, as a net commodity exporter, benefiting from higher crude prices and stronger terms of trade, though rising fiscal risks and currency volatility remain key overhangs. |
| South Korea (75.6%) and Taiwan (25.7%) outperformed in 2025, driven by the semiconductor and AI cycle, but remain highly sensitive to global tech demand, high export dependence, and geopolitical risks. |
| Emerging markets are essential to a well-diversified portfolio. They are, by nature, cyclical, responding to fluctuations in crude oil prices, USD strength, and global liquidity. This means short-term volatility is inherent to the asset class. However, over full market cycles, this volatility is rewarded with stronger returns and genuine diversification benefits. |
Recommended for you
Readers also explored

India’s Unemployment Rate in 2025

Currency in Circulation: How Much Money Exists in the World?
How Capital Flows Across the Developed and the Emerging Markets
Global capital never stays still. It moves across geographies and asset classes in search of the best risk-adjusted return, constantly rotating between emerging and developed markets.
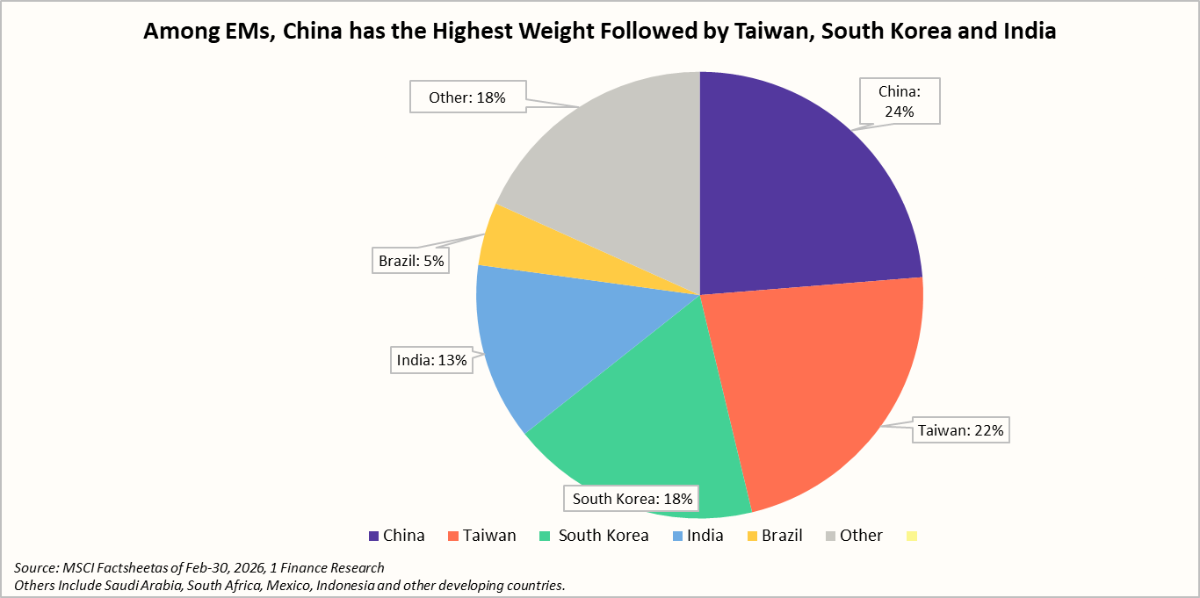
To better understand this rotation, we look at two of the world's most widely followed benchmarks: the MSCI Emerging Markets (EM) Index, which covers large- and mid-cap equities across major emerging economies and its counterpart, the MSCI World Index, which captures the performance of developed markets, dominated by the United States, Europe, and Japan.
The EM index is dominated by China with 24% weight, followed by Taiwan (22%), South Korea(18%), India (13%), and Brazil (5%). This tilt means EM performance is heavily influenced by a handful of large, tech and semiconductor-heavy markets.
Over the past 20 years, the Emerging Markets (EM) have outperformed developed markets in 9 years and underperformed in 11 years, indicating a shifting risk-reward preference. Three variables explain most of this swing.
First, the Fed’s rate cycle, which anchors global risk appetite. Rate cuts ease financial conditions and typically drive capital into emerging markets, while rate hikes tighten liquidity and trigger outflows.
Second, the US dollar acts as the transmission channel. As the world’s primary safe-haven currency, a stronger dollar pulls capital away from EMs and tightens financial conditions, whereas a weaker dollar supports inflows and asset price expansion.
Crude oil is the third variable and the most important one for 2026. A demand-driven oil rally (such as 2005–2007) reflected strong global growth and supported EM earnings, particularly for commodity exporters. In contrast, supply-driven shocks such as the Russia-Ukraine War pushed Brent above $100 per barrel, fueling inflation and forcing central banks into aggressive tightening, triggering capital outflows from EMs.
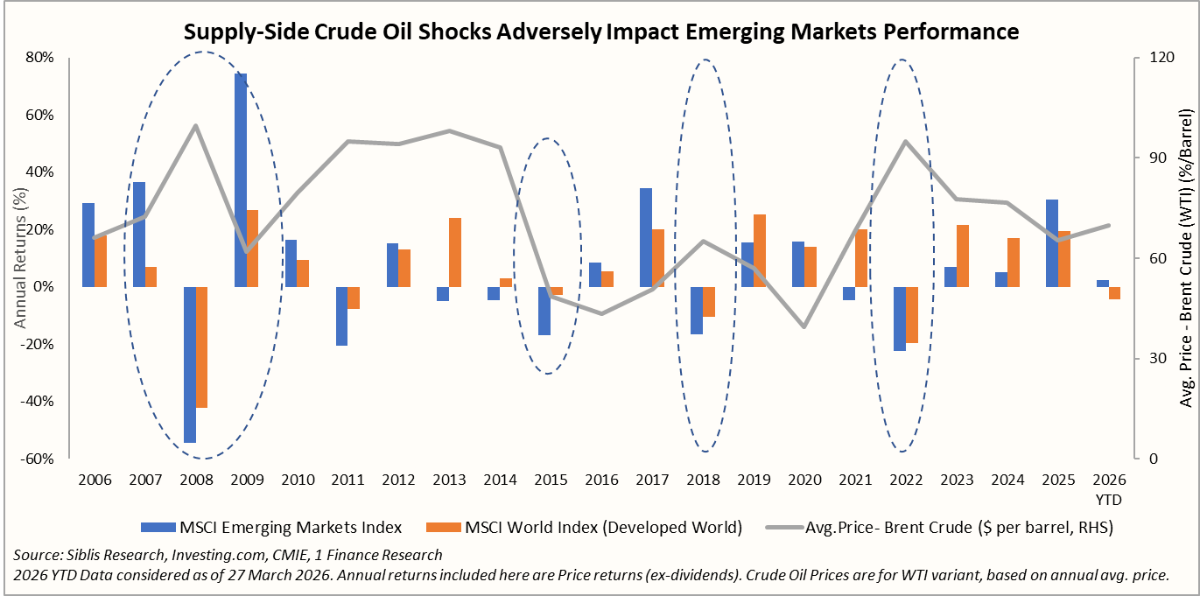
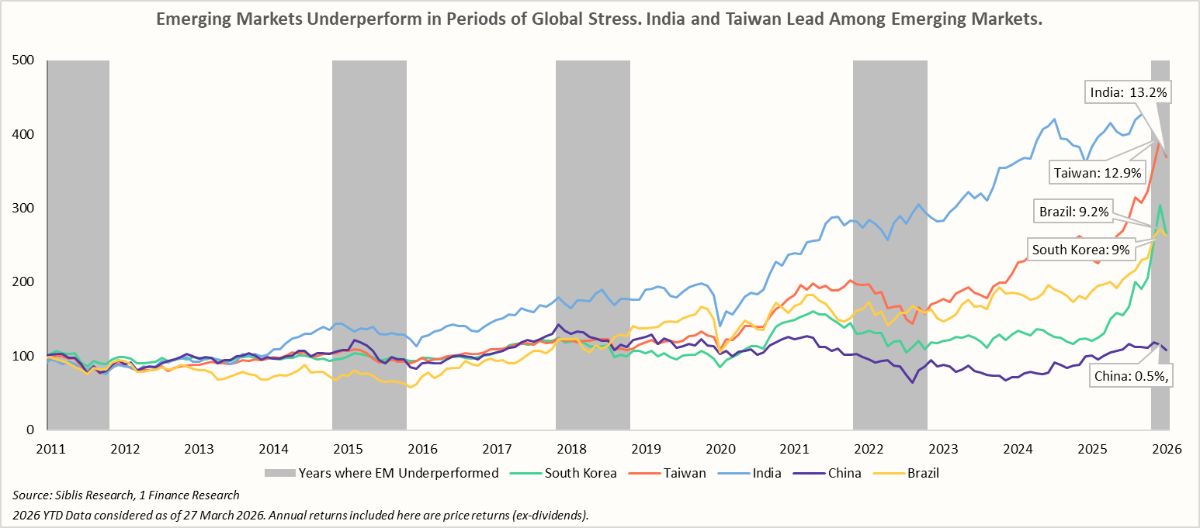
Emerging markets typically underperform during geopolitical stress, with sharp drawdowns seen in 2008, 2015, 2018, and 2022, periods marked by global shocks and tightening liquidity.
In 2008, the MSCI Emerging Markets Index fell by ~55%, with major markets also dropping over 40%. By contrast, 2022 was less severe, with declines around ~22%, reflecting more resilient macro buffers and policy responses.
How Key Emerging Markets Performed Over Major Stress Periods
The five major emerging markets: India, China, South Korea, Taiwan, and Brazil capture the diversity of growth drivers, risks, and cyclicality across the Emerging Markets universe.
India has remained a steady compounder with an annualised return of 13% between 2011 and 2025, supported by strong domestic demand and consistent earnings growth. Taiwan (12.9%) also showed strength, benefiting from export-driven growth.
Brazil (+9.2%) and South Korea (9.0%) have remained more cyclical, reflecting sensitivity to commodity prices and global trade cycles, respectively, leading to occasional drawdowns and sharper recoveries soon thereafter.
On the other hand, China (+0.3%) lost momentum post the COVID-19 pandemic, weighed down by geopolitical tensions and weaker domestic demand, resulting in a sustained downtrend.
In 2025, EMs saw a decisive turnaround, driven by Fed rate cuts, a weaker dollar, and benign crude oil prices, leading to a strong ~11% outperformance over DMs. In 2026, the backdrop appears to be changing completely. Rising crude, driven by tensions around the Strait of Hormuz, is triggering safe-haven flows into USD assets, tighter liquidity, and renewed pressure on currencies and equities.
Let’s see how major emerging markets performed in 2025 and how their domestic economies and equity markets are positioned in 2026.
| Market | 2025 Performance and Growth Drivers | Outlook and Risks for 2026 |
|---|---|---|
| India (NIFTY-50) | NIFTY-50 (+10.5%) lagged the EM Index (+30.6%) in 2025, with performance held back by higher valuations and persistent foreign capital outflows. In 2022, Nifty-50 (+4.3%) did better than most EM peers, which were affected by the volatility sparked by the Russia-Ukraine war. | Nifty-50 is well-supported by strong consumption-driven growth, and remains the fastest-growing large economy. NIFTY-50 valuations have corrected considerably, but Crude oil prices and INR depreciation remain major risks for 2026. |
| China (Hang Seng Index) | China’s Hang-Seng Index gained ~18.4% in 2025, led by large-cap internet, financials, and policy-driven re-rating. Oil sensitivity is lower despite ~40% imports via the Strait of Hormuz, due to diversified sourcing and secured maritime routes. | HSI Valuations (P/E:~14x) are genuinely cheap relative to other EM peers, but sentiment remains fragile. Structural long-term headwinds persist, such as weak consumer confidence and real-estate overhang. US-China tech and trade escalations remain a key global risk for 2026. |
| Taiwan (TWSE Index) | Taiwan’s TWSE Index gained 25.7% in 2025, driven mainly by semiconductor leadership. TWSE fell 22.4% in 2022, identical to the MSCI EM, reflecting its tech sector's sensitivity to the US Dollar. | TWSE valuations (PE: 28.4x, Median: 17.2x) remain high but have been supported by earnings growth. In 2026, China-Taiwan geopolitical tensions, export concentration (driven by TSMC), and global demand cyclicality remain major macro risks. |
| South Korea (KOSPI Index) | South Korea’s KOSPI surged ~75.6% in 2025, driven mainly by semiconductors (AI-cycle exports). KOSPI was the strongest performer among major EMs. South Korea imports ~70–75% of its energy needs, and remains vulnerable to oil price shocks. | South Korea's economy remains linked to the global semiconductor cycle, as chips contribute ~15–20% of its exports. Therefore, weaker US tech demand and spillovers from China's slowdown remain key risks for 2026. |
| Brazil (Ibovespa) | Brazil’s Ibovespa gained ~34% in 2025, supported by commodities' strength and relatively attractive valuations. In 2022, the Ibovespa (+4.7%) was one of the least affected EM markets. Brazil benefits from higher oil prices through stronger export revenues and improved external balances. | A key macro risk for Brazil is its rising public debt (~95% of GDP), increasing its fiscal vulnerability. Its trade exposure to the US is limited to ~12% of its exports, offering relative insulation from tariff shocks and direct policy actions. |
Where Emerging Markets Go From Here in 2026
From here, 2026 could evolve along two clear paths. If the Middle-East tensions ease over the next few weeks and crude returns to below ~$80 levels, global risk appetite is likely to recover, capital flows could resume into emerging markets, stabilise their currencies, and moderate inflation pressures in these economies.
However, if the conflict extends into the second half, persistently elevated crude prices would sustain safe-haven flows, tighten financial conditions, and trigger outflows from EMs, putting pressure on their currencies and weighing on growth-sensitive equities.
Even relatively stronger and consumption-driven economies like India would not be immune. Higher oil would bring inflation, strain fiscal balances, limit policy flexibility, and weigh on corporate margins and valuations despite strong domestic demand.
For an investor in India, emerging markets offer attractive medium-term potential, supported by higher growth and cyclical outperformance. Exposure can be accessed through international ETFs, mutual funds, and feeder funds, providing diversified, professionally managed access to global EM equities. Additionally, investors can use the LRS route for direct international investing, enabling broader diversification across geographies and sectors.
Concluding Remarks
Emerging markets and developed markets differ fundamentally in structure and drivers. While developed markets (US, UK, Japan, etc.) offer stability and predictable policy frameworks, emerging markets are driven by economic growth and demographics (India, China), commodity cycles (Brazil), and specialised exports (South Korea and Taiwan). This makes EMs more sensitive to global liquidity, the US dollar, and commodity cycles (crude Oil).
As a result, EMs tend to underperform during periods of stress (2008, 2022, etc.), often marked by capital outflows, currency depreciation, and tighter financial conditions. These drawdowns are therefore a structural feature rather than an anomaly.
For investors, EMs are best approached with a disciplined, medium-term allocation, recognising that volatility and drawdowns are integral to capturing their structural growth and diversification benefits.