India entered 2026 in a Goldilocks zone, delivering high GDP growth above 7% with low inflation, while the world showed signs of a slowdown. GDP growth for Q3 FY26 came in at 7.8%, powered by stronger industrial and services sector growth.
But beneath the headlines, fault lines are forming. Crude oil above $110/barrel, a tense Strait of Hormuz, and an inflation trajectory pointing upwards. This blog unpacks what's truly driving India's growth at the sectoral level, what the GDP methodology revision actually changes, and why the RBI's next move may be more constrained than the current inflation number suggests.
| Section | Key Takeaways |
|---|---|
| GDP Growth |
|
| Inflation |
|
| Monetary Policy |
|
India’s Q3 GDP Growth Powered by Manufacturing and Services
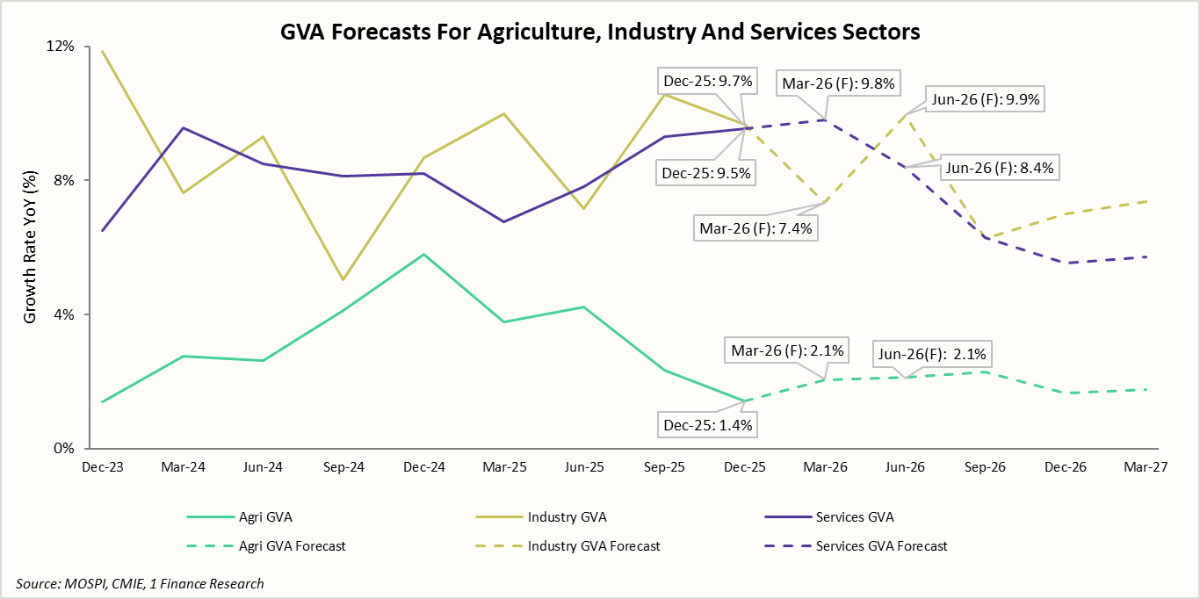
India’s GDP growth for Q3 FY26 (Oct–Dec 2025) came in at 7.8%, easing slightly from 8.2% recorded in Q2 FY26 (Jul–Sep 2025). Among the key sectors, Industry GVA grew 9.7%, led by manufacturing, while construction (6.6%) and Mining and quarrying (4.7%) sub-sectors also contributed meaningfully.
Services GVA also grew 9.5% in Q3 FY26, improving from 9.3% in Q2 FY26. Growth within the sector was led by financial, real estate and business services (12.9%) and trade-related segments (11.0%).
The table highlights the GVA growth and the underlying trends in key sectors and sub-sectors.
| Sectors | Q3 FY26 Growth (YoY) | FY26 Trend |
|---|---|---|
| Overall GVA | 7.8% | Steady Growth |
| Agriculture, forestry and fishing | 1.4% | Slower Growth |
| Industry | 9.7% | Increasing but Cyclical |
| Construction | 6.6% | Steadily Increasing |
| Mining and quarrying | 4.7% | Stable |
| Manufacturing | 13.3% | Sharply Accelerating |
| Electricity, gas, water supply & other utility services | 1.5% | Stable |
| Services | 9.5% | Consistently Strong |
| Financial services, real estate and business services | 12.9% | Notably Accelerating |
| Public administration, defence and other services | 4.5% | Stable |
| Trade, hotels, transport, communication and broadcasting services | 11.0% | Notably Accelerating |
If we look at the demand side indicators, Private Final Consumption Expenditure (PFCE), which makes up ~55% of India’s GDP, accelerated to ~8.7% in Q3 FY26, and has risen considerably from ~6% levels seen through 2023-2024.
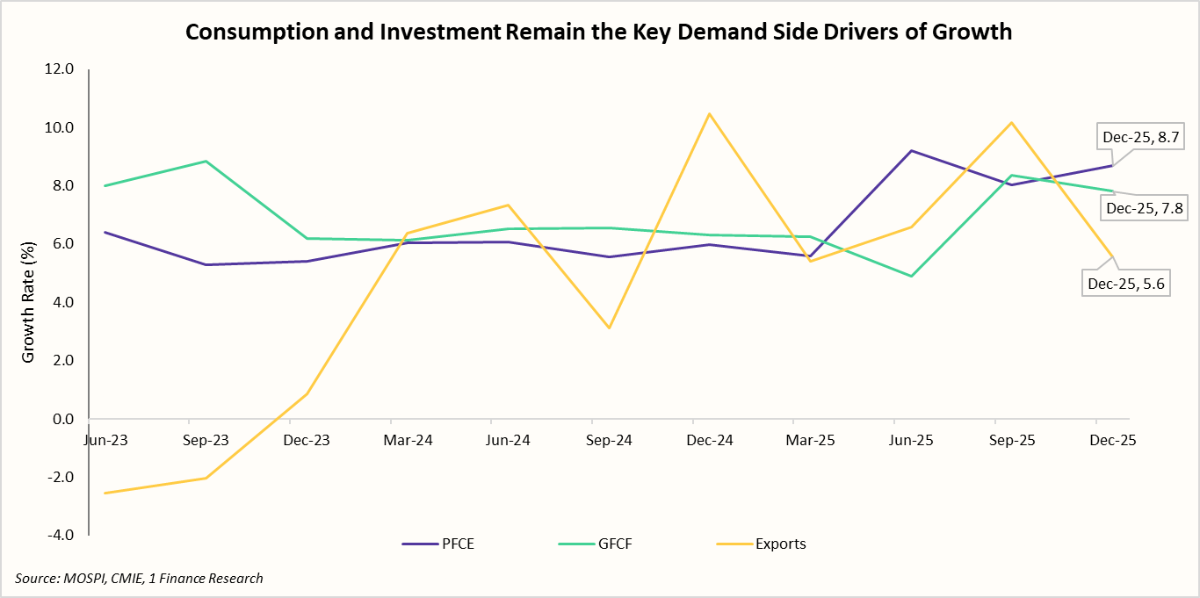
Investment activity also remains steady. Gross Fixed Capital Formation (GFCF), which contributes ~30% to GDP, moderated to ~7.8% in Q3 FY26 from ~8.3% in Q2 FY26, but remains well above the levels seen in recent years.
Exports of goods and services grew 5.6% in Q3, slowing down from a sharp 10.2% in Q2 FY26. The moderation highlights the export sector’s sensitivity to global economic conditions.
Recommended for you
Readers also explored
Growth Momentum Moderates Amid Economic Shifts
India's IT Sector Outlook for FY2026
Taken together, the demand and supply indicators suggest an environment that is ripe for capital expenditure with rising consumption, improving investment appetite and healthy corporate margins, combined with supportive policies (rate cuts, GST rationalisation).
For Q4 FY26, 1 Finance projects GDP growth of ~7.4%, contributing to a full-year FY26 estimate of ~7.6%. While the services sector is expected to lead this expansion, industrial growth is likely to stay cyclical in nature. Looking further ahead to FY27, growth across both sectors is forecast to slow, primarily weighed down by an unfavourable base effect.
Key risks to growth in FY27 include a weaker-than-normal monsoon affecting rural demand and output in the agricultural sector, higher input costs and uncertain exports affecting the industry sector. Emerging technologies such as Artificial Intelligence also remain an added risk, which could disrupt jobs and slow growth in services, especially in IT and related sectors.
With these headwinds, it is also worth understanding how the GDP methodology was revised and what factors have changed.
Firstly, the base year has been updated from 2011–12 to 2022–23, meaning the economy is now assessed against a more recent and representative benchmark, providing a more relevant picture. The revision also expanded the data sources used, such as GST filings, corporate records from the MCA21 database, and updated sector-level surveys.
On the technical side, the revision recalibrated the price indices used to adjust for inflation, incorporated faster and more frequent economic indicators, and refined how different sectors of the economy are classified and measured. Taken together, these changes make the GDP estimates more timely and more representative of actual economic conditions.
Importantly, the revision also improved how the informal economy is captured, a critical fix, given that informal businesses and workers still make up a large share of India's economic activity. It also refined the treatment of financial services and ensured better consistency between the supply and demand sides of the economy.
With growth on a firm footing, the other side of the macro equation, i.e. inflation, also needs attention and what it means for the broader economy.
Inflation in Check, But Looming Risks Put MPC in a Policy Quandary
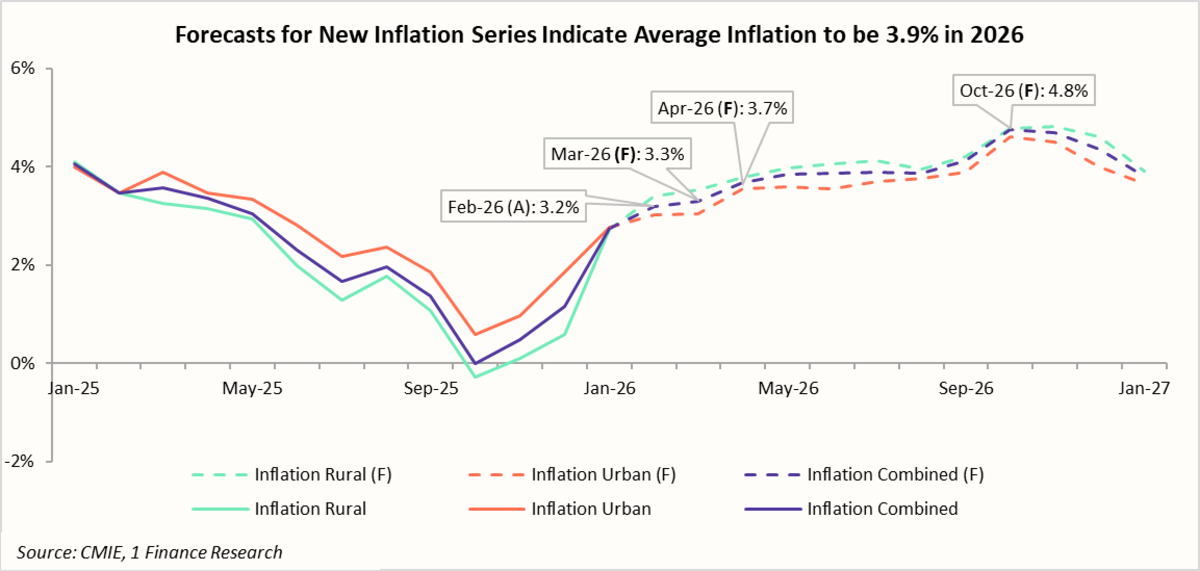
India’s overall inflation currently stands at a comfortable 3.2%, well within the RBI's target band, offering some breathing room. However, the crude oil prices surging past $110 per barrel pose multiple risks as elevated energy costs tend to seep into fuel, transport, and food prices, and if sustained, could push headline inflation much higher.
Our inflation forecast for the year 2026 currently stands at ~3.9%, with inflation expected to reach 4.8% by Oct-26. Higher crude prices pose upside inflation risks, as a $10/barrel increase is expected to add another ~40 bps to headline inflation.
This leaves the RBI's Monetary Policy Committee (MPC) in a policy quandary. While the softening inflation provides room for a rate cut to stimulate growth, spiralling energy costs could quickly reverse the trend, making rate cuts a risky bet. The committee will need to tread carefully, balancing near-term growth support against the threat of a renewed inflationary spike.
The table below covers the list of indicators that the RBI would be weighing in its next monetary policy meeting.
| Factor | Case For a Rate Cut | Case For a Pause |
|---|---|---|
| Inflation (CPI) | At 3.2% (Feb-26), well below the 4% target, providing room for easing | Inflation is likely to increase in the near term, making a rate cut unlikely for now |
| Crude oil price & imported inflation | De-escalation in Hormuz could bring prices back to prior levels | 50% of India's crude transits through Hormuz; prolonged disruption feeds directly into CPI |
| Rate Cut Cycle Progress | Real rates remain positive (difference between repo rate and inflation), indicating room for another cut | MPC explicitly flagged in Feb-26 that it wants earlier cuts to transmit before acting again |
| Currency risk | INR has stabilised after trade deal announcements with the US and EU. RBI's $720 bn forex buffer provides cushion | A cut widens the rate differential with the US Fed, increasing capital outflow risk |
| Growth Outlook | GDP growth projected to slow to 6.5% in FY27; domestic demand would benefit from easing | A pause preserves policy space for future cuts when transmission is clearer |
| Core Inflation | Core CPI at 3.4% (Feb-26) has been stable and range-bound | Second-round effects from crude typically hit the core with a 4–6 month lag |
| Global Central Banks' Stance / Fed | The US Fed held its interest rates in Mar-26, giving the RBI breathing room to ease independently. | Fed’s caution signals global uncertainty; a cut could trigger capital outflows and bond market volatility |
On balance, despite low headline inflation and positive real rates, rising risks from crude oil uncertainty and lagged policy transmission suggest the RBI’s MPC is likely to pause and assess evolving macro and geopolitical conditions.
Concluding Remarks
India’s Q3 FY26 performance reinforces its position in the “Goldilocks phase”, a rare combination of strong growth and low inflation. A revival in manufacturing, strengthening private consumption, and continued growth in the services sector have together created a favourable economic backdrop.
However, the inflation and monetary policy picture introduces complexity. The RBI finds itself at a delicate juncture, as the headline inflation remains below the target, but the trajectory is upward; real rates remain positive, but geopolitical tensions are tightening the room for independent action. The crude oil channel, amplified by the Strait of Hormuz exposure, is the variable most likely to shift the MPC's calculus in the quarters ahead.
For investors, the near-term picture is constructive but not without its nuances. Domestic consumption-oriented sectors are well-positioned. However, IT and export-facing services face dual headwinds of an AI-driven disruption and softer global trade momentum. Currency stability supported by the recently announced trade deal frameworks will provide a degree of macro insulation.
India's structural growth story remains intact. FY27 will be a year of defending that story against rising crude prices, stubborn global headwinds, and a monetary policy stance that may offer less tailwind than the current inflation numbers suggest.