Portfolio Diversification is the practice of distributing your investments over several asset classes to reduce the potential risk. Asset allocation goes a step beyond using mathematical formulation of strategies that will reduce risk and create a positive goal.
This reading explains portfolio diversification and how our asset allocator tool considers age, macroeconomic phases, and asset classes to determine a preferred allocation.
What is Portfolio Diversification?
Portfolio Diversification is a portfolio management strategy that, at its core, is about not putting all your eggs in one basket. It involves strategically spreading your investments across a diverse range of asset classes, securities and investment types. This asset allocation strategy aims to lessen risk and smooth out the volatility in your portfolio over time by limiting exposure to any single investment or asset.
The idea is that by investing in a mix of different asset classes, you increase your chances of withstanding market fluctuations. That is because different asset classes tend to react differently to market changes.
An example of this can be seen in the below chart.
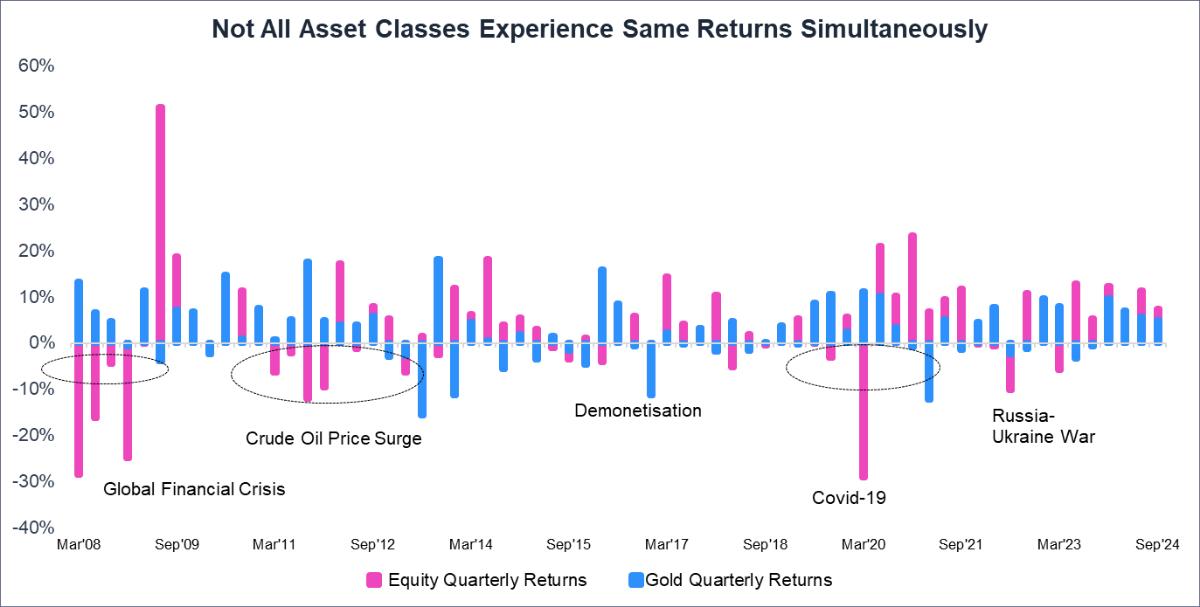
- Not all asset classes move together. The chart above shows the quarterly returns of equity and gold from March 2008 to September 2024, clearly illustrating their differing performance.
- For instance, during the Global Financial Crisis (first quarter of 2008), equity fell by 29%, gold rose by 13% as investors sought safe haven assets. While the most dramatic moments of the crisis, such as the Lehman Brothers collapse, happened in the US and other developed markets in September 2008, financial markets are globally interconnected.
- Even before September 2008, there were warning signs of trouble in the global financial system. These included rising defaults in the US subprime mortgage market throughout 2007 and early 2008, indicating underlying instability; increased volatility and uncertainty as markets grew nervous about the potential for wider problems; and credit market tightening as banks became less willing to lend money, a sign of stress in the financial system.
- Problems in one part of the world can quickly spread to others. Similar trends are evident during other market events, such as the crude oil price surge, demonetisation, and the COVID-19 pandemic. This pattern of low correlation across asset classes highlights the potential benefits of diversification.
Why Diversify Across Various Asset Classes?
Before explaining the importance of portfolio diversification within the context of investment portfolio optimisation, it's important to present both the advantages and disadvantages of diversification. So, let's first delve into the controversies and then explore the benefits to provide a balanced perspective.
Does diversification always deliver the promised benefits? In the world of value investing, particularly the fundamental approach, the picture gets a bit more complex. While diversification is undoubtedly a cornerstone of prudent portfolio management, it's not a one-size-fits-all solution. Like most things in finance, it involves trade-offs.
Increased diversification presents two potential challenges:
Diminishing Returns:
At some point, adding more assets to a portfolio can lead to progressively smaller increases in returns. Think of it this way: your initial investments might offer the highest potential, but as you diversify further, you'll inevitably include assets with lower expected returns.
Diluted Due Diligence:
The time and resources required to thoroughly evaluate each new asset can stretch your capacity. This can potentially reduce the depth of your analysis for both new and existing holdings, impacting the overall quality of your investment decisions.
Here are 3 arguments to illustrate the benefits of diversifying across various asset classes:
1. Predicting the Future is Impossible:
- Now, if adding more assets can potentially lower expected returns, why not simply concentrate your investments in the assets projected to deliver the highest returns? The answer lies in the inherent uncertainty of investing.
- No matter how skilled you are, predicting the future is impossible. The best you can do is tilt the odds in your favor, but you can never eliminate the possibility of being wrong. Therefore, building a margin of safety—both at the individual asset level and the portfolio level—is absolutely critical.
- So, if we accept that we can be wrong about any single asset, how do we determine the appropriate level of diversification? In my view, the tipping point comes when a single incorrect decision could seriously jeopardise the portfolio's value. If one bad call could inflict damage that other investments are unlikely to offset within a reasonable timeframe (say, a year), then your portfolio lacks the necessary margin of safety.
- The table below might help you see why and when diversification matters:
| Two Scenarios to Consider | |||
| Abundance of High-Return Assets | Scarcity of High-Return Assets | ||
Market Conditions: | Imagine a market environment where numerous assets offer similarly attractive returns. |
Market Conditions: | Consider a more typical scenario where assets offer a range of returns, with each additional asset offering a progressively lower return. |
Impact of Diversification: | Low Cost: Adding more high-return assets doesn't significantly reduce the portfolio's overall expected return. Benefit: Diversification reduces risk without sacrificing much in terms of potential gains. |
Impact of Diversification: | High Cost: Including more assets means incorporating those with lower returns, which can drag down the portfolio's overall performance. Trade-off: Diversification reduces risk, but it comes at the cost of potentially lower returns. |
| Conclusion: | In this scenario, a well-diversified portfolio makes perfect sense. | Conclusion: | Here, a more concentrated portfolio (focused on the few highest-return opportunities) might be considered to maximise returns. However, it's crucial to maintain a minimum level of diversification to avoid excessive risk. |
“In a nutshell, in both the scenarios, abundance of high-return assets or scarcity of high-return assets, always maintain a base level of diversification to manage risk.”
2. Hedge Against Inflation:
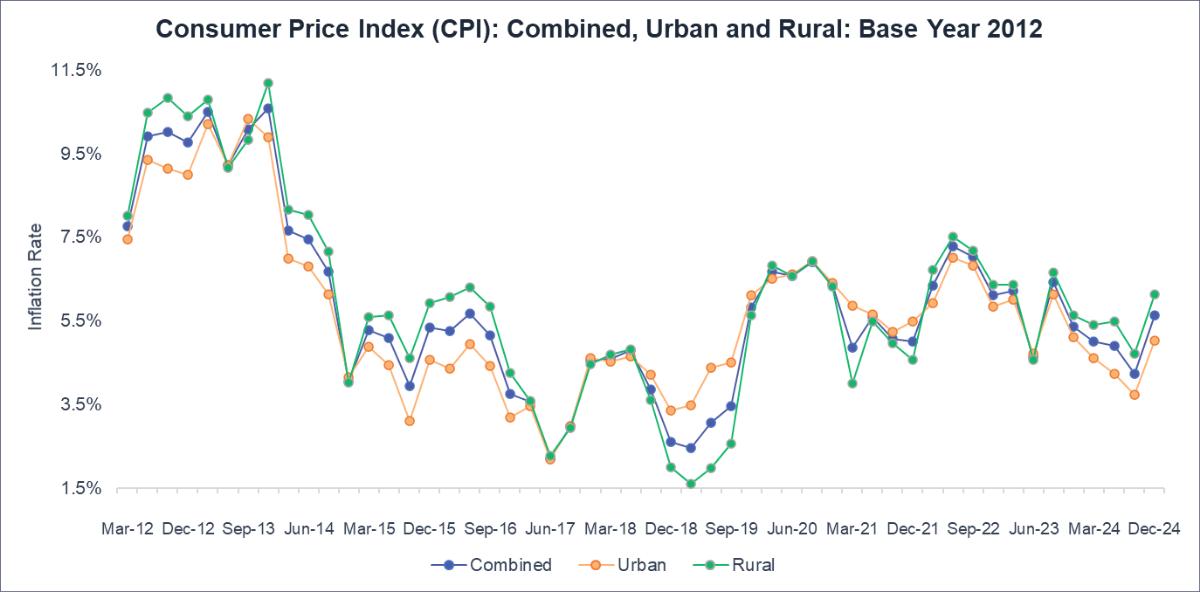
- The chart above shows the quarterly year-over-year percentage change in inflation (CPI general index), with 2012 as the base year. Combined inflation reached as high as 11% in December 2013.
- Inflation reduces the real value of money. It is often said, "If your investments are not growing at a rate higher than the inflation rate, you are effectively losing money." Consider a conservative investor with all investments in fixed income. Inflation erodes the returns on fixed-income investments like fixed deposits and bonds. If you are earning 6% on a fixed deposit, but inflation is 5%, your real return is only 1%.
- How can investors protect their portfolios from the impact of rising inflation? One strategy is to diversify into asset classes that tend to hold their value or even increase in value during inflationary periods. The point is not to discourage investing in bonds or fixed deposits, but to diversify across various asset classes, such as equity, gold, real estate, bonds, and passive income assets.
- It is important to remember that no single asset class is a guaranteed inflation hedge. The best approach is to diversify across a range of asset classes to mitigate risk and maximise returns.
Recommended for you
Readers also explored

Using Risk-Return Scatter Plots for Portfolio Optimisation

World GDP Breakdown 2025: Who Powers the Global Economy?
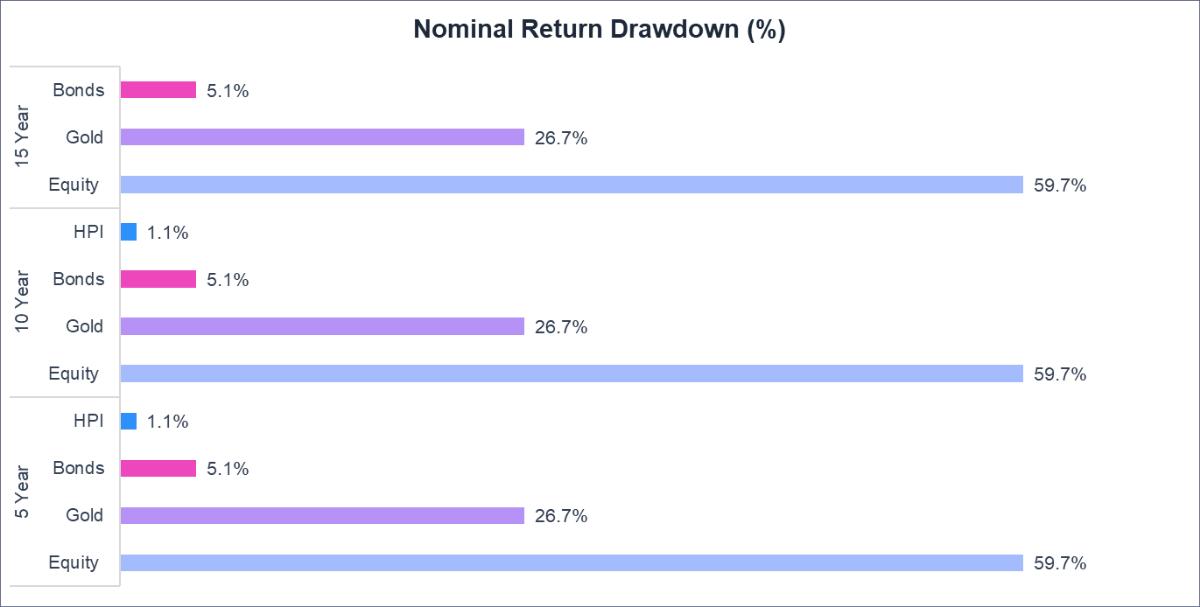
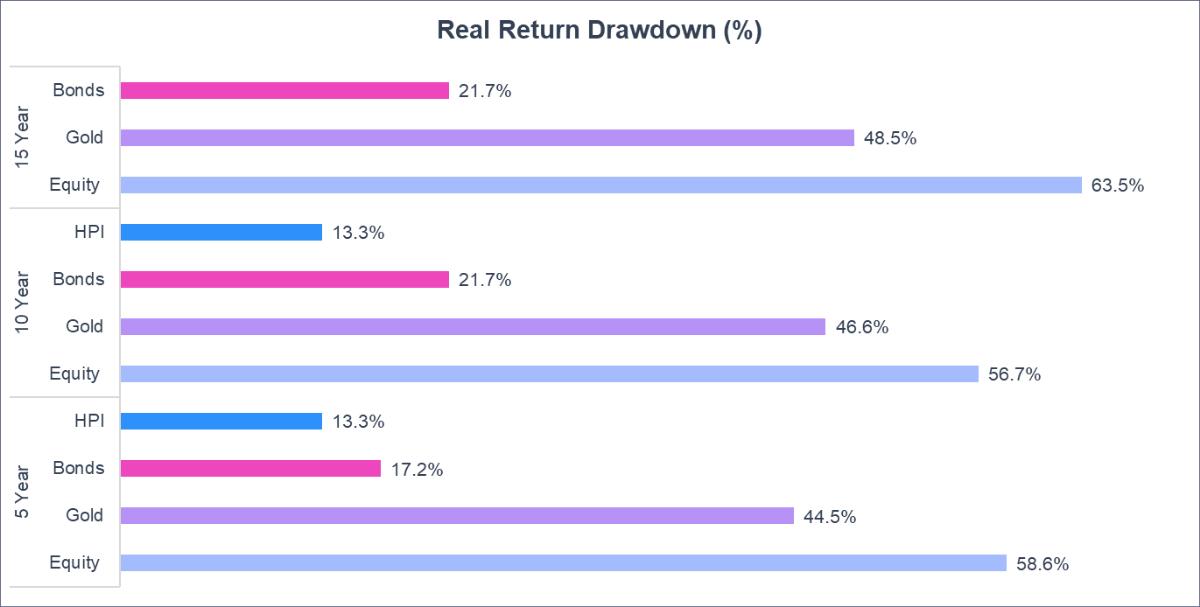
3. Drawdown Survival Guide:
- A recent study analysing historical asset drawdowns, using data from LSEG/Refinitiv Datastream and the RBI, reveals a crucial lesson: diversification is key.
- Drawdowns represent the peak-to-trough decline during a specific period, providing crucial information on the risk and resilience of different investments. This is especially relevant for long-term investors and those structuring retirement portfolios, where the duration and severity of downturns can have profound implications.
- The findings were striking: equity, while offering high potential returns, also experienced the most significant and prolonged declines. This reinforces the crucial role of diversification in managing portfolio risk.
- Gold, despite its reputation as a safe haven, also saw few drawdowns.
- Bonds offered more stability, but even they weren't immune to losses.
- This highlights the importance of diversifying across asset classes to manage risk and potentially enhance long-term returns.
- The chart below will help you understand nominal and real return drawdowns of various asset classes over different time frames (5, 10, and 15 years).
What Inputs Make Up Our Asset Allocator Tool
1. Asset Classes
Equity:
The NIFTY 500 index was selected as a proxy for the Indian equity market due to its broad representation of publicly traded companies. Daily closing prices were used for return calculations.
Real Estate:
Data from the National Housing Bank (NHB) for India's top 10 cities, along with a general housing index from the Bank for International Settlements (BIS), were combined to form a comprehensive real estate index. Quarterly returns were derived from this index.
Passive Income Asset:
A proprietary index aggregating the performance of leading Real Estate Investment Trusts (REITs) and Infrastructure Investment Trusts (InvITs) was constructed. This index was then integrated with broader real estate data to create a comprehensive Passive Income Asset Index. Daily price data from Yahoo Finance was utilised for return calculations.
Debt:
An index representing the daily returns of a diversified selection of three debt mutual funds, covering a significant portion of the debt market spectrum, was created. Data was obtained from ACE MF.
Alternative Investment:
Daily price data for UTI Gold ETF was sourced from ACE MF to represent the performance of gold as an alternative investment.
2. Age Group
Our tool helps you find the right asset allocation strategy by considering different age ranges. It's important to remember that your investment portfolio optimisation strategy needs to change as you age.
| Below 35 years | |
| Goals and Requirements | This phase marks the early career stage, where individuals focus on skill acquisition and career development. Financial goals typically revolve around achieving independence and establishing a solid financial foundation. |
| Diversification Strategy | This age allows for a greater allocation towards growth-oriented assets like equities, with a focus on long-term capital appreciation. |
| 36-45 years | |
| Goals and Requirements | As individuals progress in their careers and income levels rise, they may encounter increased financial responsibilities, such as supporting a family or caring for aging parents. |
| Diversification Strategy | While still maintaining a growth-oriented mindset, investors in this phase may seek a balance between growth and stability. This could translate into a diversified portfolio with a mix of equities, real estate, and passive income assets to generate both capital appreciation and steady income streams. |
| 46-55 years | |
| Goals and Requirements | This phase often represents peak earning years, with individuals potentially assuming leadership roles and enjoying greater financial stability. With retirement on the horizon, the focus may shift towards preserving wealth and generating income for future needs. |
| Diversification Strategy | A more conservative asset allocation, emphasising stable income-generating assets like bonds and dividend-paying stocks, may be appropriate at this stage. |
| Above 55 years | |
| Goals and Requirements | Individuals at this age are either retired or actively planning for it. For those already retired, financial goals may shift towards pursuing personal interests and prioritising health. For those still planning, the focus may be on maximising retirement savings, ensuring adequate insurance coverage, and establishing estate plans. |
| Diversification Strategy | A conservative approach to asset allocation, prioritising capital preservation and income generation, becomes increasingly important. |
3. Macroeconomic Phases
The following macroeconomic phases can significantly influence investment opportunities and risk profiles. The economy goes through several macroeconomic phases, namely, Growth, Strong Recovery, Weak Recovery, Transitory Slowdown, Sharp Slowdown, and Recession.
The Growth phase is characterised by:
- Economic Expansion
- Robust GDP Growth
- Low Unemployment
- Rising Corporate Profits
The Strong Recovery phase is characterised by:
- Robust Rebound in Economic Activity
- High Consumer and Business Confidence
- Increased Spending and Investment
- The economy may still be operating below its full potential.
- An example of a strong recovery phase in India would be the period between Oct-20 to Sept-22, the post-pandemic recovery driven by stimulus measures and pent-up demand.
The Weak Recovery phase is characterised by:
- Sluggish Rebound in Economic Activity
- Subdued Consumer and Business Confidence
- Lower Investment Enthusiasm
- Weak recovery occurs when initial policy reforms start stabilising the economy, but structural adjustments keep growth modest.
The Transitory Slowdown phase is characterised by:
- Temporary Deceleration in Economic Growth
- Moderate Pace of Economic Growth
- Rising Interest Rates
- Supply Chain Disruptions
- An example of a transitory slowdown in India would be the 2008 global financial crisis and the GST and demonetisation impact in 2016-2017.
The Sharp Slowdown phase is characterised by:
- Rapid and Significant Deceleration of Economic Activity
- Global Economic Weakness
- Geopolitical Tensions
- Financial Market Instability
- An example of a sharp slowdown in India would be the period of Jun-91 to Sep-91, triggered by the 1991 balance of payments crisis, leading to high inflation, fiscal deficits, and sluggish growth.
The Recession phase is characterised by:
- Economic Contraction
- Declining GDP
- Rising Unemployment
- Falling Corporate Profits
- Pessimistic Investor Sentiment
- High Risk Aversion
- Technically, India has never experienced a recession.
Model Assumptions and Formulations
Annualised Returns:
Annualised returns were used to provide a one-year tactical outlook for portfolio diversification. While daily/monthly returns are too volatile for long-term decisions, longer periods can obscure tactical opportunities from changing economic conditions.
A one-year timeframe balances short-term noise with relevance to the coming year, aligning with the model's tactical nature. It empowers investors to make agile adjustments based on macroeconomic phases, capturing opportunities and mitigating risks.
Return Stratification:
To assess performance across macroeconomic phases, annualised returns for each asset class were first ranked in ascending order.
This ranking allowed for a clear delineation of relative performance within each asset class. The data points were then divided into three equal segments, with the lowest 33.33% of returns classified as "low," the middle 33.33% as "medium," and the highest 33.33% as "high." The mean return was then calculated for each of these three segments, providing a representative value for each performance category.
Ideal Weights Determination:
By combining this return matrix with pre-determined weight ranges for each asset class, the model derives optimal asset allocations tailored to different economic phases and investor age groups.
How To Get Started With All This Information?
Before we delve into what to do, let's first understand what not to do. We often learn from experience, and investing is no different. Here's a list of frequent errors to avoid.
1. Over Diversification
Portfolio sprawl, also known as overdiversification, occurs when an investor holds too many accounts, too many individual securities, or invests across an excessive number of asset classes. This can lead to portfolios that are unwieldy and difficult to manage, potentially hindering returns. It's a common issue, affecting both large and small portfolios. While it might seem counterintuitive, holding a large number of investments—even small positions—can create a false sense of security and wealth, while actually hindering performance. It's important to remember that diversification aims to balance risk and return; overdiversification can dilute both.
2. Failing to Adjust the Portfolio with Age
As we age and approach retirement, a more conservative approach is generally advisable. The focus typically shifts towards generating steady income and prioritising capital preservation over aggressive growth. However, some investors may inadvertently increase risk at this stage or neglect to incorporate safer asset classes into their portfolios. It's understandable that after a lifetime of work, financial security and peace of mind become paramount. It's crucial to remember that adjusting a portfolio to reflect one's age and evolving needs is essential for long-term financial well-being.
3. Mutual Fund Overlap
Many investors believe they're diversified by holding multiple mutual funds. However, if those funds share the same underlying securities, the diversification benefit is significantly reduced, or even eliminated, effectively concentrating your investments. A Mutual Fund Overlap Calculator helps identify this by calculating the common stocks and their average weight between multiple funds. It compares portfolios, computes overlap, and pinpoints the top shared stocks and their individual and average weights.
4. Asset Allocation Not in Line With the Goals
Investors often have wants and desires, but frequently neglect to define clear financial goals. This is a critical oversight. Setting well-defined goals is essential for successful investing. Clear objectives provide direction, especially during uncertain times, and maintain motivation and discipline, particularly during market downturns. Knowing what you're working toward reduces the likelihood of impulsive decisions, such as panic selling during market fluctuations. An individual saving for a near-term objective, like funding their child's education in a few years, will likely have a lower risk tolerance than someone investing for retirement decades away. Clear goals enable you to determine an appropriate level of risk for your portfolio. Just as in life, a lack of purpose can create uncertainty, defined financial goals provide focus and motivation.
Now that we know what not to do, let's delve into what to do. Follow these steps to learn how to use our tool effectively:
Making the Most of the Asset Allocator Tool
Considering the factors we've discussed above—asset class, macroeconomic phase, and age—our tool provides actionable steps for investors to build their portfolios. We've developed four key components:
1. Asset Allocator Pie Chart
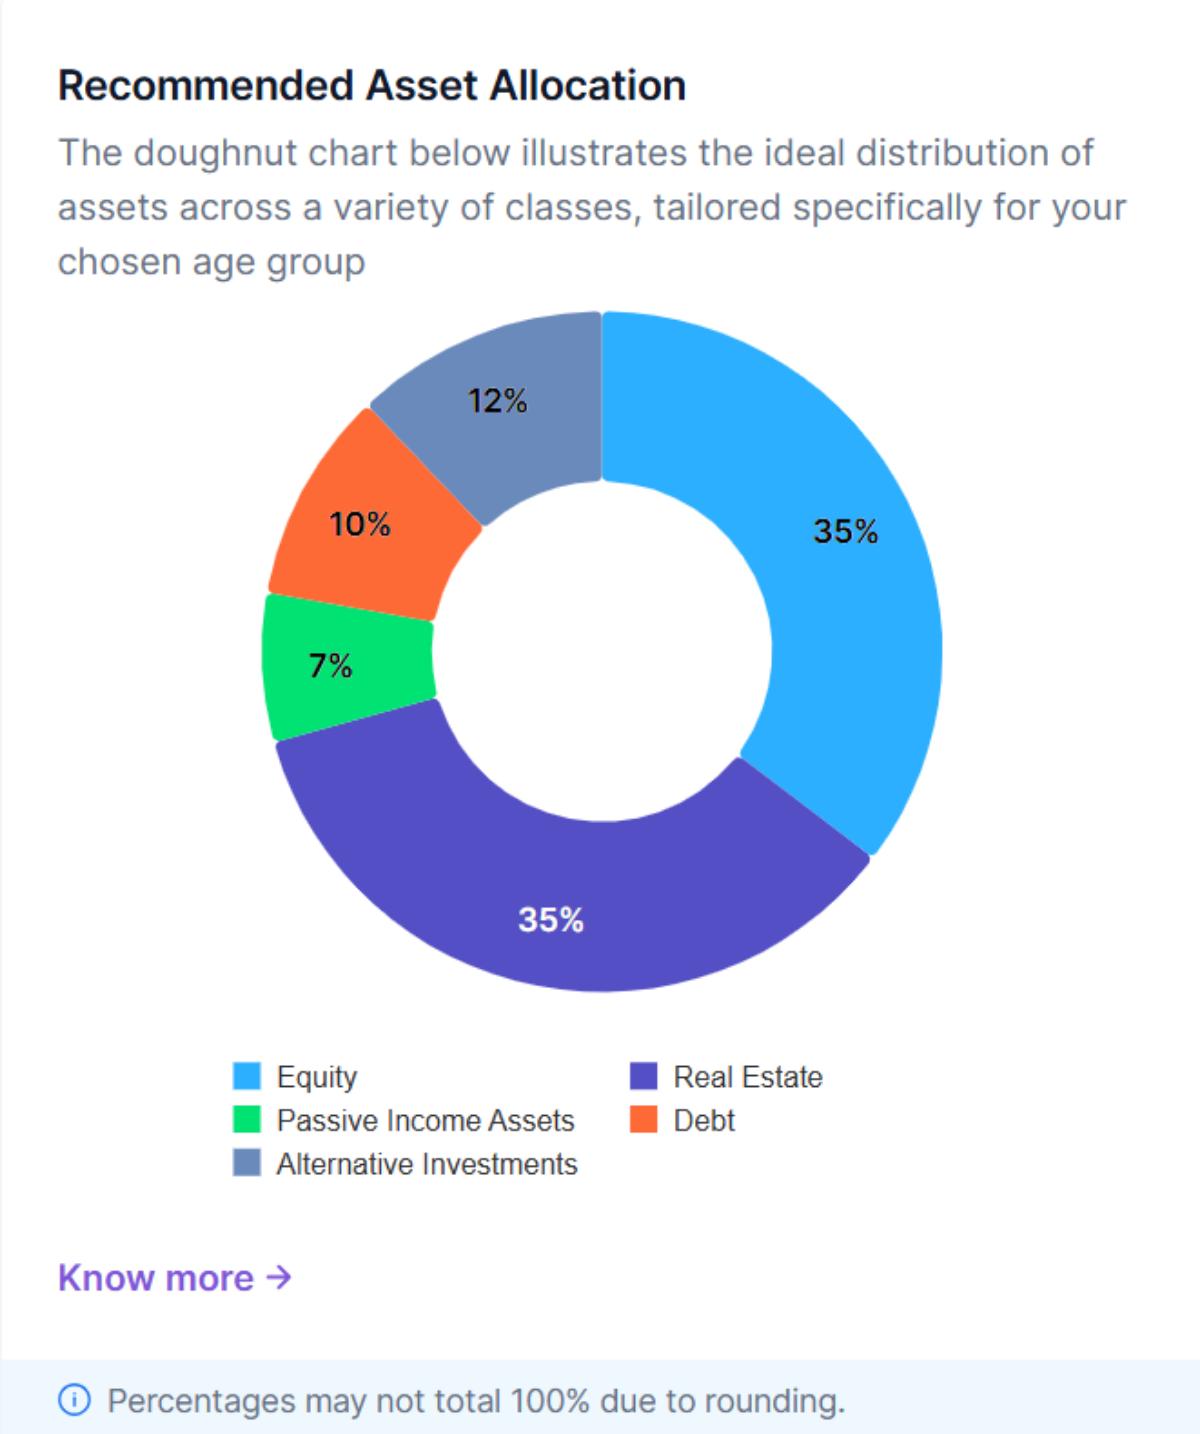
How to Use the Asset Allocator Pie Chart?
This chart visually represents the recommended asset allocation. It's designed for easy interpretation: each slice represents an asset class, and its size reflects the suggested percentage allocation within the portfolio.
Users can simply select their age range to quickly grasp the overall diversification strategy and the relative importance of each asset class in achieving the desired risk-return balance.
2. Portfolio Risk-Return Scatter Plot
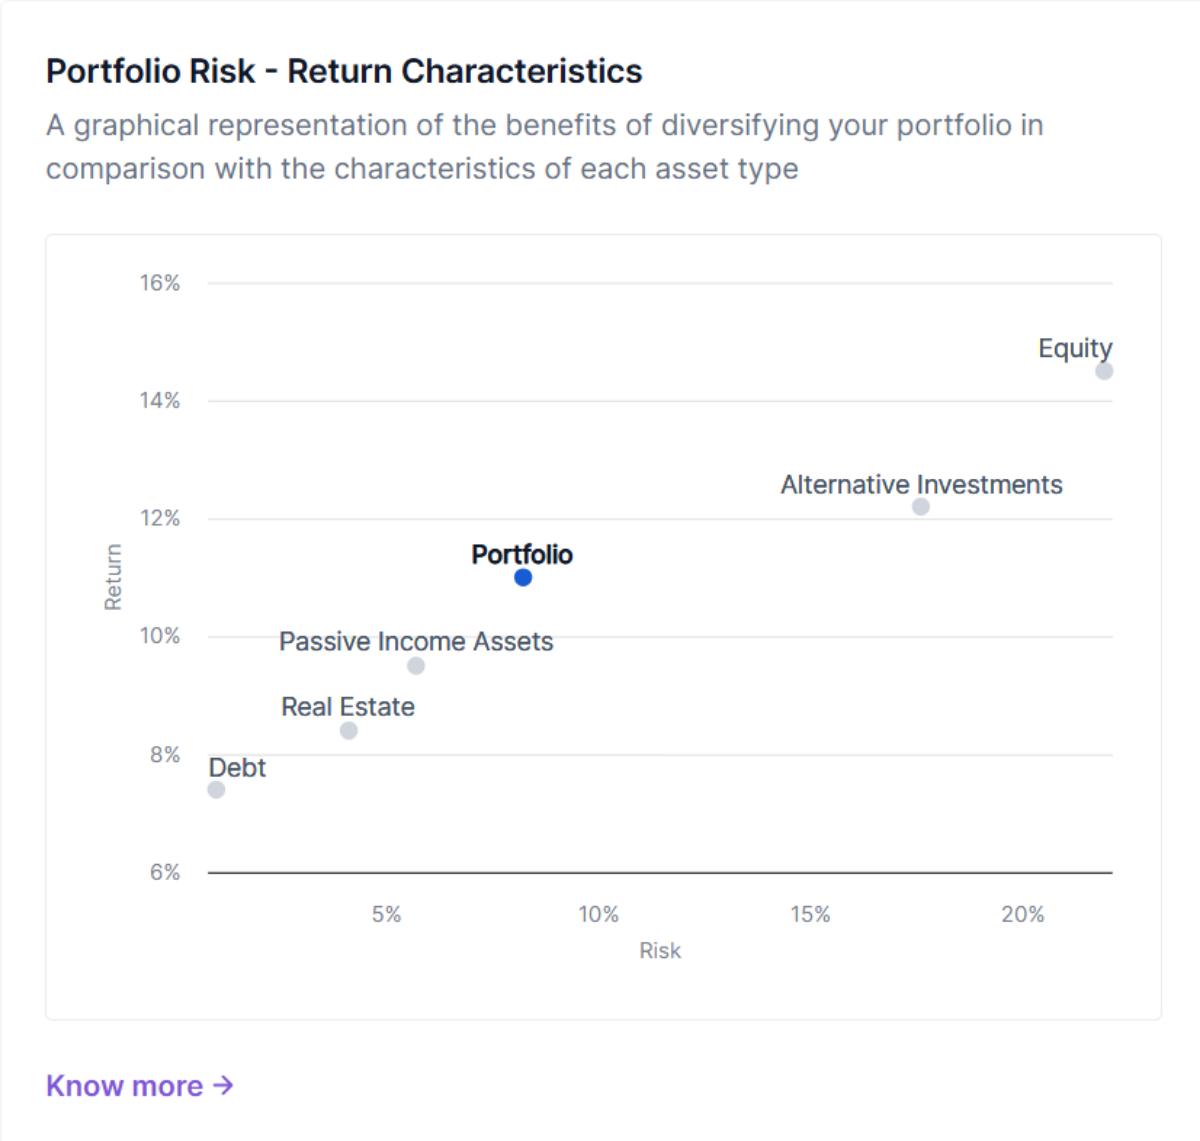
How to Use the Portfolio Risk-Return Scatter Plot?
This plot visually illustrates the risk-return scatter plot for each asset class and the overall portfolio. Risk, measured by standard deviation, is plotted on the X-axis, and annualised expected return is on the Y-axis.
The overall portfolio's risk-return profile, achieved through diversification, is also plotted. This helps investors visualise the benefits of diversification compared to a portfolio concentrated in a single asset class.
3. Correlation Matrix
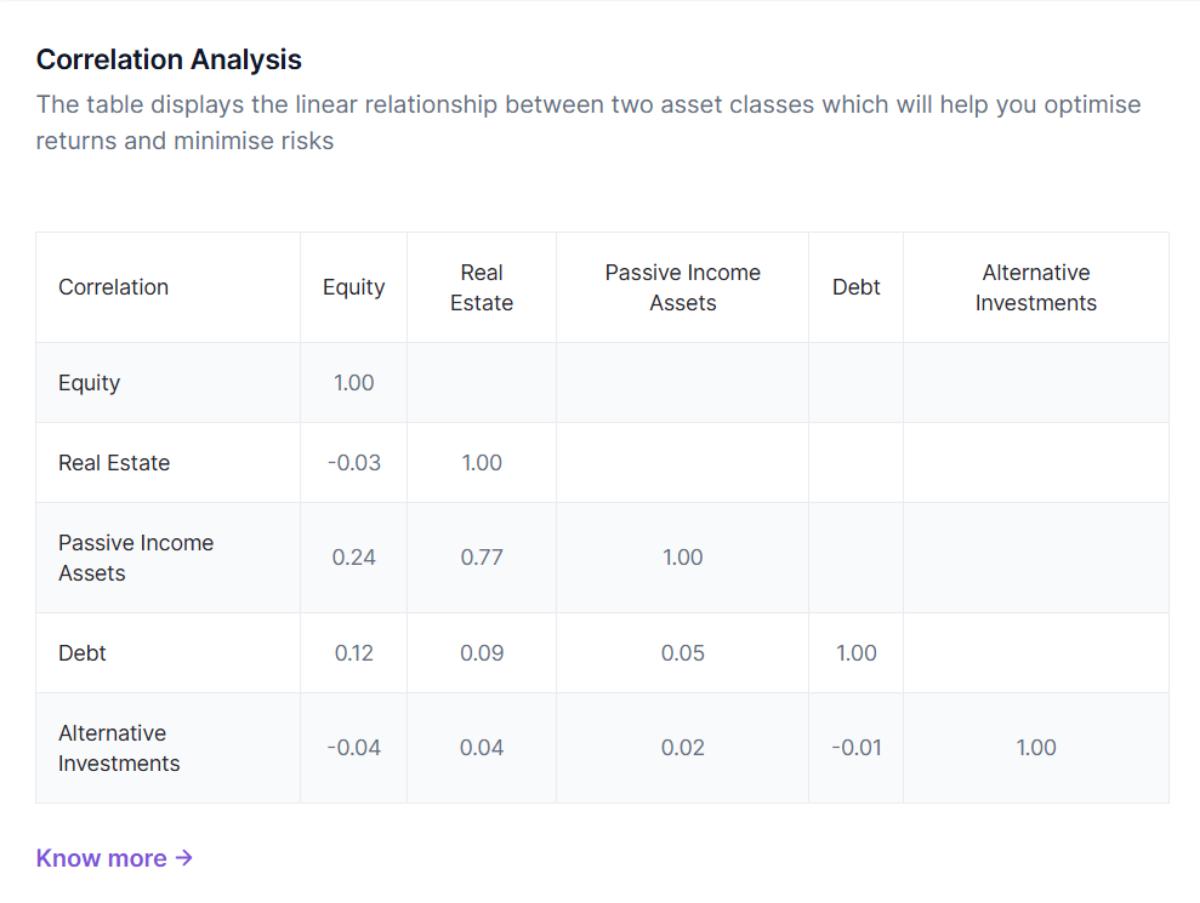
How to Use the Correlation Matrix?
This matrix displays the correlations between the daily returns of various asset classes. Correlations range from -1 (perfect negative correlation) to 1 (perfect positive correlation), with 0 indicating no linear relationship.
It's a valuable tool for understanding asset class interaction. Investors can use this to strategically diversify portfolios by identifying assets with low or negative correlations, potentially reducing overall volatility and mitigating risk.
4. Portfolio Reward to Risk Ratio Table
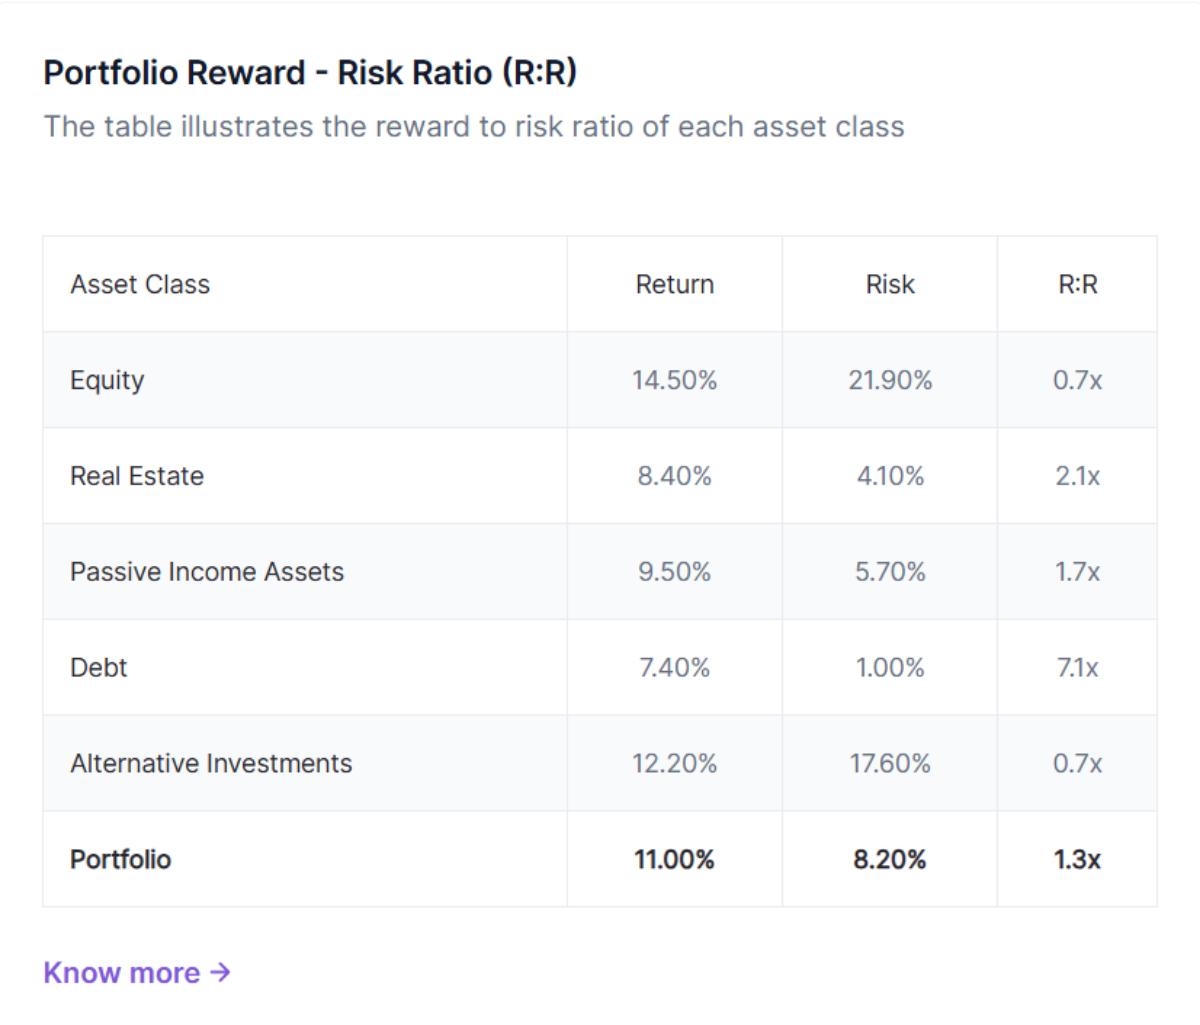
How to Use the Reward to Risk Ratio Table?
This table details the estimated returns, risks and reward to risk ratio for each asset class and the overall portfolio. Returns are presented as annualised percentages, reflecting expected gains over one year. Risk is quantified using standard deviation, measuring the dispersion of returns around the mean.
This allows for a direct comparison of risk and return across different asset classes and provides a quantitative basis for evaluating portfolio efficiency.
Important Reminder for Investors
While the Asset Allocator provides invaluable insights, it is essential to acknowledge that investment decisions should not be solely based on this output. It is imperative to consider individual and behavioral factors such as financial goals, time horizon, and tax implications. Consultation with a qualified financial advisor can provide personalised guidance and ensure that investment decisions align with an individual's broader financial plan.
The Macro Asset Allocator is not a crystal ball, and its projections are based on historical data and current economic phase. Market dynamics can change rapidly, and unforeseen events can occur. Therefore, regular portfolio reviews and adjustments are necessary to maintain alignment with evolving circumstances and investment objectives.