Understanding asset correlation is fundamental to modern portfolio theory. By identifying and exploiting both positive and negative correlations, investors can construct portfolios that optimise risk-adjusted returns. This involves a deep understanding of how different asset classes interact and how their relationships evolve over time.
Traditional portfolio construction often relies heavily on stocks, bonds, and cash. While this provides a foundational framework, exploring alternative asset classes can significantly enhance diversification and potentially improve risk-adjusted returns. This may include real estate and passive income assets.
"Diversification by itself is not a strategy, nor is it an investment style. It is merely a common-sense approach to managing unavoidable risk." - Harry Markowitz
Key Takeaways
- Asset correlations show how different investments move together or apart - together (positive), opposite (negative), or independently (non-correlated).
- Portfolio diversification helps reduce investment risks.
- Different economic conditions affect how investments relate to each other.
- Regular monitoring of correlations is essential for better returns.
- A correlation matrix is a tool to visualize investment relationships.
- Understanding correlations helps make smarter investment choices.
Types of Correlation
First let’s understand what is correlation.
Asset correlation measures how closely the price movement of two assets are related.
- Positive correlation:
When there is a positive correlation between two asset classes it means when one asset class increases in value, the other one increases as well. Conversely, when one asset class decreases in value, the other asset class decreases as well. - Negative correlation:
When there is a negative correlation between two variables it means when one asset class increases in value, the other decreases in value. - Non-correlation:
When there is no correlation between two asset classes it means that movement of price of one asset class will not be associated with another asset class.
Also, it is of utmost importance to know that asset correlation is not static. For instance, the correlation between US Treasuries and equities has shifted significantly over time. This underscores the need for a dynamic approach to asset allocation, constantly reassessing and adjusting to changing market conditions.
As we dive further it will be even more clear that debt is not homogeneous. Within the fixed-income space, correlations vary considerably. Government bonds may exhibit low correlation with equities, while corporate bonds, particularly high-yield, can exhibit greater correlation. Recognising these nuances is crucial for effective portfolio diversification and portfolio risk management.
Inflation can significantly impact asset correlations and portfolio performance. In inflationary environments, the traditional diversification benefits of certain asset classes may diminish. This necessitates a careful evaluation of portfolio positioning and potential adjustments to mitigate inflation risk.
Now that we have wrapped our heads around the factors that influence correlations, it is important to have clarity on how each asset class is defined:
Recommended for you
Readers also explored
Portfolio Diversification: Guide to Smart Asset Allocation

Currency in Circulation: How Much Money Exists in the World?
Types of Asset Classes
- Equity
Investments that represent company ownership, with the potential for capital appreciation and income through dividends. They are often considered as the primary asset class and provide investors with capital appreciation and dividend income. - Real Estate
It involves direct ownership of property. Property investments that are non-yielding made either to occupy or to benefit from capital appreciation. As the industry progresses, we can indirectly invest in the form of Real Estate Investment Trusts (REITs). - Passive Income Assets
Investments that generate a regular stream of income with little to no active involvement. This asset class has no primary stream that generates secondary income. A few examples of Passive Income Assets are income from rental property, income generated from renting out a car, etc. - Debt
Investments that generate a fixed rate of return and have a predetermined maturity date. This category of asset is considered less risky than equities. - Alternative Investments
Investments that do not fall into traditional asset classes. This category has recently gained popularity. It offers diversification and has the potential for capital appreciation. An example of an alternative investment will be gold.
Macroeconomic Phases and Asset Correlations
The prevailing macroeconomic environment significantly influences the performance and correlations of various asset classes. During economic expansions, characterised by robust growth and optimistic investor sentiment, equities tend to outperform. However, as the economy slows down or enters a recession, investors may flock to safer havens like alternative or debt instruments, leading to a potential shift in correlations among asset classes. By understanding these cyclical patterns, investors can enhance their portfolio risk management strategies by anticipating changes in asset class behavior and adjusting their portfolio allocations accordingly.
Factors Influencing Asset Class Correlations
Understanding the dynamic nature of asset class correlations is paramount for constructing and managing a resilient investment portfolio. These correlations, the degree to which different investments move in tandem, are not static but rather evolve due to a complex interplay of macroeconomic, geopolitical, and market-specific factors.
- Macroeconomic Phases:
The broader economic landscape plays a pivotal role in shaping asset class behaviour. During expansionary phases, characterised by robust economic growth, rising corporate profits, and low unemployment, equities tend to flourish. Conversely, during recessions or slowdowns, when economic activity contracts and uncertainty prevails, investors often gravitate towards safer havens like gold. These shifts in investor preferences can lead to significant changes in correlations, with equities and bonds sometimes moving in opposite directions. - Global Events:
Geopolitical events, such as trade wars, elections, financial crises, and military conflicts, can introduce significant uncertainty into financial markets. These events can trigger flight-to-safety responses, altering investor behaviour and consequently impacting asset correlations. For example, during the 2008 Global Financial Crisis, correlations between various asset classes spiked as investors sought refuge in safe-haven assets like gold. - Economic Indicators:
Fluctuations in key economic indicators, such as gross domestic product (GDP) growth, inflation rates, unemployment rates, and consumer sentiment, can significantly influence asset class correlations. Rising inflation, for instance, can erode the real returns of fixed-income investments, leading investors to reallocate towards equities or real assets like real estate or commodities. - Investor Sentiment:
The collective mood and behaviour of investors, often driven by news, economic forecasts, and market trends, can exert a powerful influence on asset prices and correlations. Positive sentiment can lead to increased demand for riskier assets like equities, while negative sentiment can trigger a flight to quality, driving up demand for safe-haven assets. This ebb and flow of investor sentiment can cause correlations to shift, sometimes rapidly and unexpectedly. - Market Cycles:
Different asset classes tend to perform differently across various market cycles. For example, during a recessionary period, equity and debt may exhibit a negative correlation as investors seek the relative safety of bonds. However, during a recovery or expansion phase, the correlation may turn positive as both equities and bonds benefit from improving economic conditions. Understanding these cyclical patterns can help investors anticipate changes in correlations and adjust their portfolios accordingly. - Government Policies:
Changes in fiscal or monetary policy can significantly impact financial markets and asset correlations. For instance, an unexpected interest rate hike by the Reserve Bank of India (RBI) can lead to a sell-off in bonds, potentially increasing their negative correlation with equities. Similarly, changes in tax laws or regulations can create winners and losers across different asset classes, further influencing their correlations.
Using the Correlation Matrix
| Correlation | Equity | Real Estate | Passive Income Assets | Debt | Alternative Investments |
| Equity | 1 | ||||
| Real Estate | -0.03 | 1 | |||
| Passive Income Assets | 0.24 | 0.77 | 1 | ||
| Debt | 0.12 | 0.09 | 0.05 | 1 | |
| Alternative Investments | -0.04 | 0.04 | 0.02 | -0.01 | 1 |
How to Read the Correlation Matrix?
- The correlation between equity and real estate is extremely low, at -0.03. This indicates that, on average, real estate tends to decrease by 0.03 units for every unit increase in equity. The two asset classes appear to have a weakly negative association, which suggests that investors may benefit from some degree of diversification.
- With a correlation of 0.24, equity and passive income assets show a somewhat positive link. Conversely, there is a high positive correlation of 0.77 between real estate and passive income assets. This implies that passive income assets typically rise sharply in tandem with real estate valuations.
Tips for Using This Tool Effectively
Analyze the correlation matrix thoroughly and strive to construct a portfolio with exposure to multiple asset classes that exhibit low correlation with each other.
Building a Better Portfolio
When considering how to build a better portfolio, a key question that arises is: How to Mix Different Investments Effectively? It is not uncommon to observe the number of mistakes an investor makes when creating their portfolio. We have seen many instances where an individual might have invested all their savings solely in Fixed Deposits (FDs). While there is nothing inherently wrong with this approach, the real key lies in considering all factors, including the client's risk tolerance and risk capacity. It's possible that someone with a high risk capacity may still be somewhat risk-averse in their investment behavior.
The "holy grail" of investing is often described as finding assets with:
- Negative correlation (moving in the opposite direction of equities).
- High volatility (offering returns comparable to equities while mitigating downside risk).
However, this ideal scenario is elusive. Many have attempted to achieve this combination but have fallen short.
In reality, when adding low-correlating assets to an equity portfolio, you typically experience a reduction in volatility in exchange for lower returns. Some commonly explored options include: gold, bonds, commodities, Treasury Inflation-Protected Securities (TIPS), and long-term treasuries. These asset classes generally offer diversification benefits.
Other asset classes like tangible real estate, timber, or farmland can also be considered, but they often come with significant drawbacks such as high illiquidity, transaction costs, barriers to entry, opacity, and management fees.
Once you know how to read and interpret the correlation matrix, it becomes relatively easy to allocate your funds effectively among different asset classes, taking into account all relevant behavioral factors.
Correlation Analysis
Let’s examine how these different asset classes correlate with one another in different macroeconomic phases! This activity would educate us while building an optimal portfolio:
1. Equity and Alternatively Investments
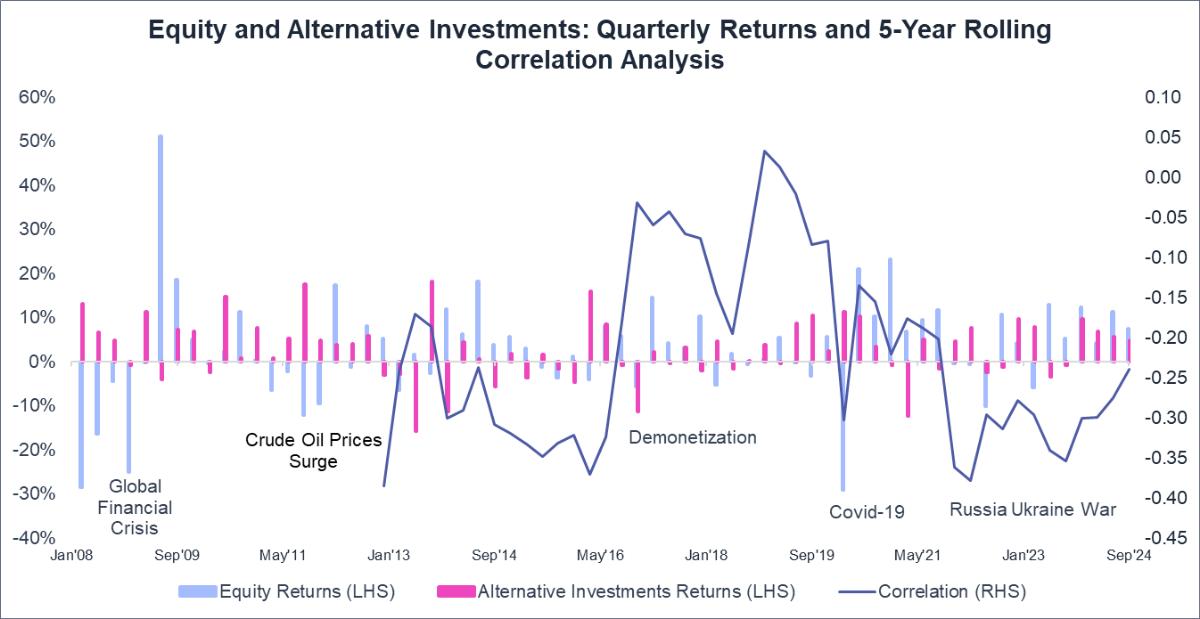
Ever wondered how Equity and Alternative Investments interact during the highs and lows of global events? The chart below shows their 5-year rolling correlation and performance (quarterly returns) from 2007 to 2024, revealing how these asset classes respond and adapt during various economic and geopolitical moments. It’s a reflection of how markets shift and investors navigate uncertainty.
Equity and alternative investments usually don’t move in the same direction—they tend to have a negative correlation. But during times of crisis, as the chart shows, that relationship can flip, and the correlation turns positive. However, it’s worth noting that in crises like COVID-19, demonetisation, or the Russia-Ukraine war, the correlation might still stay negative. Why? Because gold, as a "safe haven" asset, often draws investors away from equity when market sentiment is low and risks are high. People lean toward safety over risk in uncertain times.
Correlation Trends of Equity and Alternative Investments in Major Financial Crisis
Back in the 2008 Global Financial Crisis, gold became the go-to asset as investors flocked to it for safety, selling off equities in the process. After the dust settled, both gold and equity saw growth, but equities surged ahead with a stronger performance.
- Demonetization:
When demonetisation hit India in 2016, the relationship between gold and equity flipped, with both assets moving in the same direction due to rising uncertainty. But after that, gold continued its steady climb, while equities started to shine. - Covid-19:
In early 2020, when COVID-19 hit India, equity markets took a major dive. Meanwhile, gold held its ground and performed relatively well. As the situation calmed down, both asset classes saw gains, but equity skyrocketed in comparison. - Russia- Ukraine war:
Fast forward to early 2022, when the Russia-Ukraine war made headlines. Equity took a small hit, while gold saw a rise as investors turned to it for a safer bet. Since then, the correlation between gold and equity has stayed negative, with some volatility thrown in.
So, what’s the takeaway? Alternative investments often demonstrate a low correlation, or even a negative correlation, with traditional asset classes such as equities and debt. This characteristic can enhance portfolio diversification by reducing overall risk and potentially improving returns. Diversifying your investments across multiple asset classes might be one of the smartest ways to protect and grow your hard-earned money.
2. Equity and Debt
This chart examines the 5-year rolling correlation between equity and debt returns, alongside their respective performance (quarterly returns), from 2007 to 2024. It highlights how these asset classes responded to major global economic and financial events.
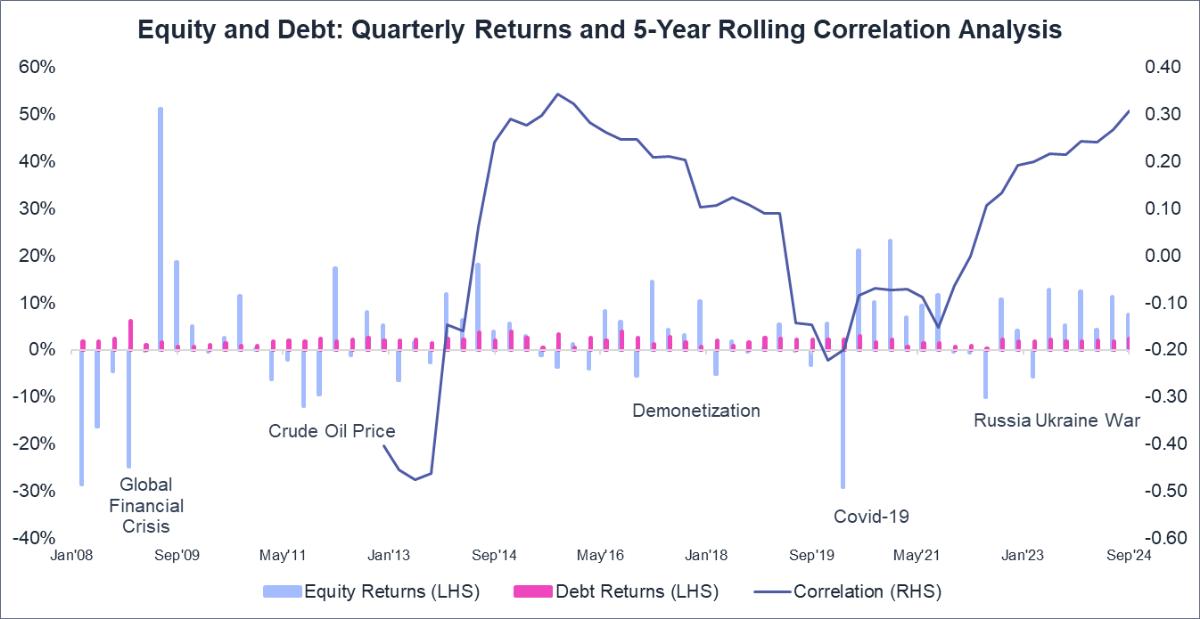
Correlation Trends of Equity and Debt in Major Financial Crisis
When comparing Equity and Debt, it's clear that they have very different risk profiles. Debt tends to be pretty steady and is seen as a safer bet, while Equity can swing wildly—offering big wins but also the chance for significant losses. If we look at the 5-year rolling correlation between the two, it gives us a sense of their relationship over a moderate time frame. Of course, shifting the time horizon—like switching to a 12-month rolling correlation could lead to different results. The chart shows that, overall, Equity and Debt have a slight positive correlation, though during periods of stress, like the Covid-19 pandemic, that flipped, with the two moving in opposite directions. Interestingly, there have been times when Equity soared, such as after the Global Financial Crisis, Demonetization, and even during Covid-19—showing how unpredictable markets can get. Inflationary pressures since 2022 have caused equity and debt returns to move more closely together, as rising interest rates impacted both asset classes negatively. Central banks have raised interest rates to combat inflation, increasing borrowing costs for companies and impacting equity valuations. Rising interest rates also lead to lower bond prices due to the inverse relationship between interest rates and bond prices. This confluence of factors has contributed to the increased correlation between equity and debt returns.
The Role of Inflation in Shaping Portfolio Diversification
- The upward trend in equity-debt correlations poses challenges for traditional 60/40 portfolio strategies, which rely on low correlations to balance risk.
- If inflation moderates, correlations may decline, allowing bonds to regain their role as a hedge against equity volatility.
- However, persistent inflation or stagflation could maintain higher correlations, requiring investors to explore alternative strategies or asset classes to diversify effectively.
3. Equity and Real Estate
This chart gives an idea of the quarterly returns of Equity and Real Estate and 5-year rolling correlation between both asset classes from 2010 to 2024.
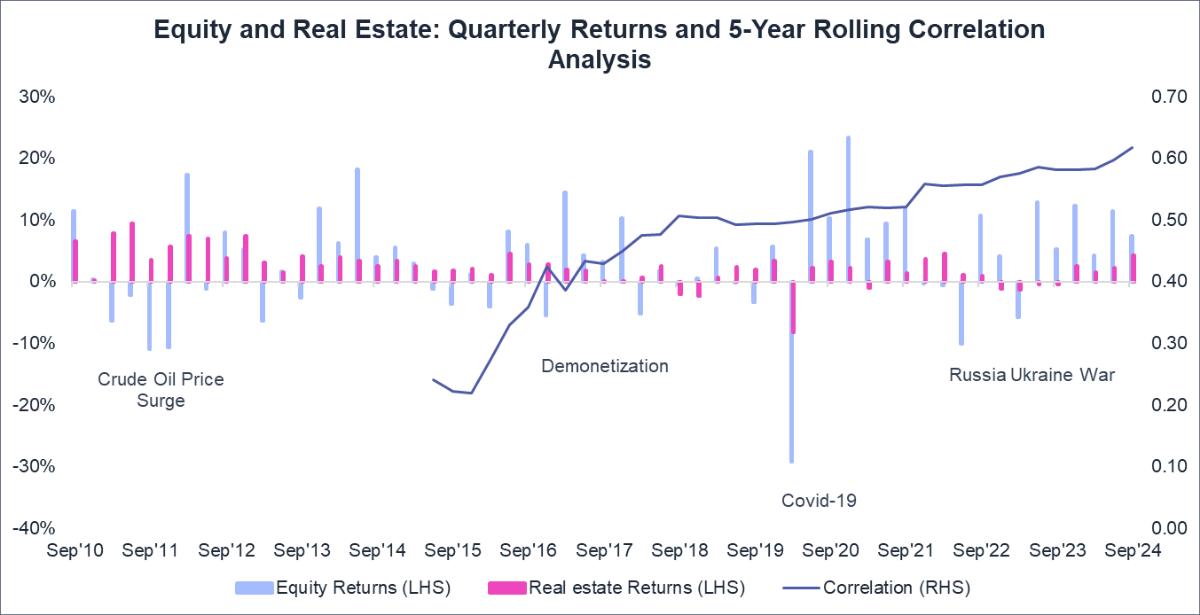
Correlation Trends of Equity and Real Estate in Major Financial Crisis:
The analysis reveals that the correlation between these asset classes has demonstrated significant variability over this period. While a generally positive correlation exists, it has exhibited periods of pronounced fluctuations, particularly during specific market events.
Interestingly, when viewed through the lens of long-term correlations, the relationship between equity and real estate often exhibits lower levels of correlation. This observation further supports the potential diversification benefits of including real estate within an investment portfolio.
4. Equity and Passive Income Assets
The chart reflects the quarterly returns of the two asset classes i.e., Equity and Passive Income Assets. The X-axis shows the period starting from Sept 2010 to Sept 2024. The Y-axis displays the returns (%) of each asset class.
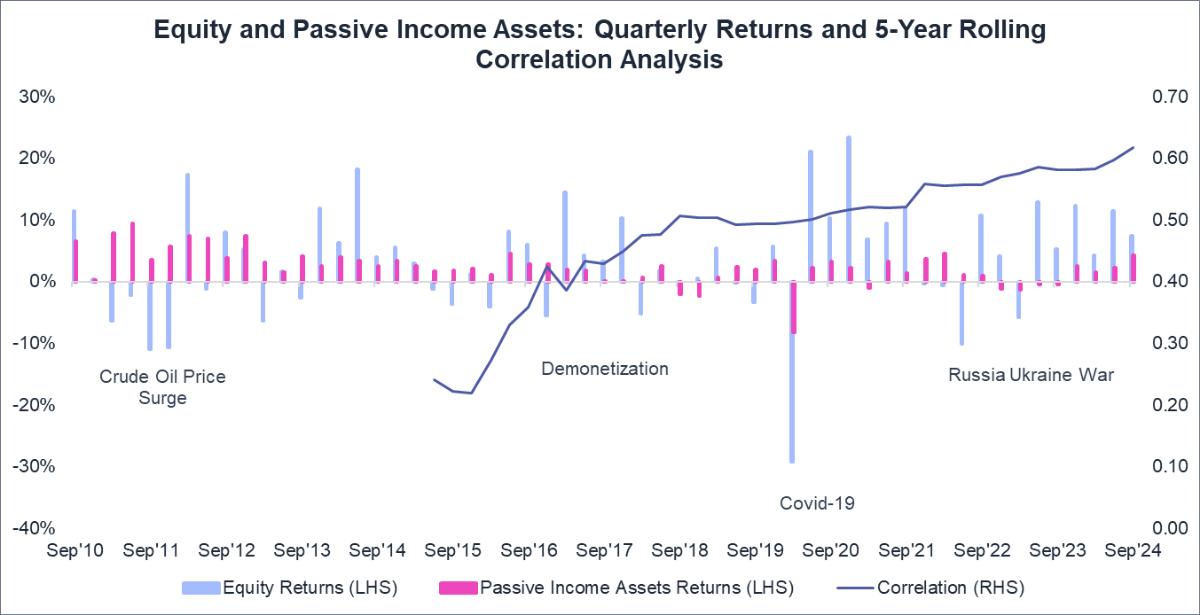
Correlation Trends of Equity and Passive Income Assets in Major Financial Crisis:
The equity performance is volatile, with significant fluctuations, including large positive and negative changes (e.g., -29.1% in March 2020 and +23.3% in December 2020). Passive Income assets generally exhibit more stability, but they also have periods of both gains and losses, though they tend to experience smaller swings compared to equities.
- There is a noticeable upward trend in the correlation between equity and passive income assets over time, particularly after 2019. For example, the correlation was around 0.22 in mid-2015 but has gradually risen to around 0.60 by mid-2024.
- In certain periods, there are notable divergences between the performance of equity and passive income assets.
For instance:
In Mar '20, equity dropped significantly (-29.1%), while passive income assets experienced a smaller negative change (-8.2%).
In Oct '22, equities saw fluctuations (positive in Q4), while passive income assets had negative returns in Q4 (-1.2%).
After significant market drops, especially in 2020 during the COVID-19 pandemic, both asset types showed recovery trends, with equities rebounding strongly by mid-2020 and continuing positive performance into 2021 and 2022.
The data suggests that while equity markets are generally more volatile, there is a growing alignment in performance with passive income assets. The rising correlation could indicate that investors may benefit from diversifying their portfolios by incorporating both assets, as they are increasingly influenced by similar market dynamics.
Regular Portfolio Check-ups
1. When to review correlations?
Review quarterly:
Markets evolve rapidly. A brief check every 3–6 months can uncover early shifts (e.g., rising correlations between equities and REITs).
Rebalance annually:
Align your portfolio with its original strategic framework, particularly for long-term holdings.
Respond to structural changes:
Geopolitical crises, central bank policies, or sudden demand for assets like gold warrant immediate reassessment.
2. How to adjust your portfolio?
This can be easily explained with a simple example:
| Old Correlation: Equity and Debt = -0.3 (Good Diversification) |
| New Correlation = Equity and Debt = +0.4 (Both rise/fall together) |
| Action: Reduce equity exposure and add alternative investments to restore balance |
Additionally, it is recommended to consider the following: If two assets are currently moving in lockstep, consider selling the riskier one. By selling the riskier asset in a highly correlated pair, you reduce exposure to a concentrated risk factor and improve the overall portfolio's risk-adjusted return.
Conclusion
The dynamic nature of asset correlations necessitates continuous monitoring and adjustment of investment strategies. Investors should remain vigilant about changes in the economic landscape, global events, and investor sentiment, as these factors can significantly impact asset class behaviour and correlations. By leveraging this understanding, investors can build resilient portfolios that align with their risk tolerance and long-term financial goals.
The Macro Asset Allocator can serve as a valuable tool in this process, providing data-driven insights into ideal asset allocations based on individual profiles and the prevailing macroeconomic environment. However, it's crucial to remember that investment decisions should not be made in isolation. Consultation with a financial advisor and a thorough understanding of personal financial goals are essential steps in crafting a comprehensive investment strategy.
Disclaimer:The performance data provided is historical and is not indicative of future outcomes. Correlations are calculated using daily total returns for each index. This information may change based on market conditions.