
Introduction
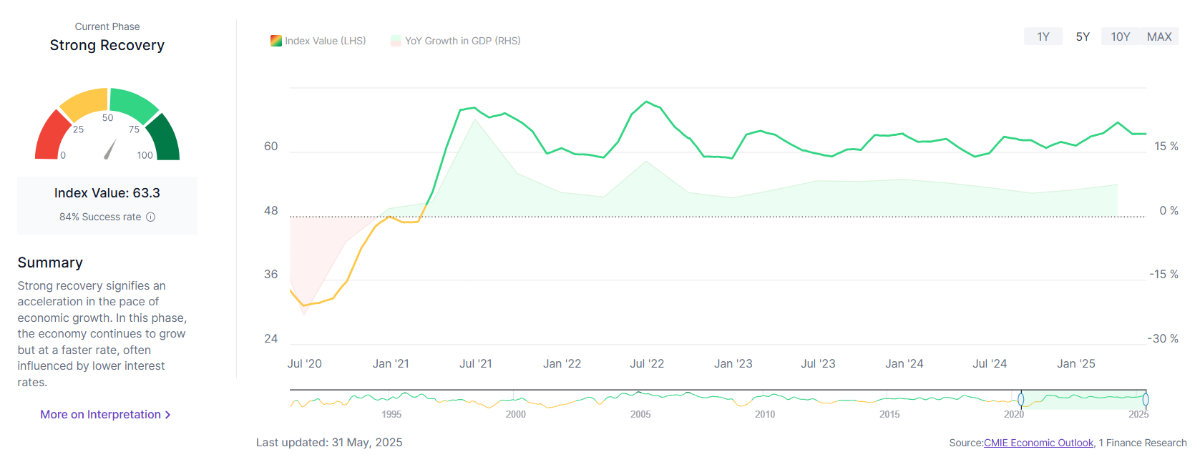
India enters the second half of 2025 with renewed economic momentum. The 1 Finance Macroeconomic Index (1FMI) currently stands at 63.3, marking a “Strong Recovery” phase. Domestic demand remains robust, inflation has cooled to a six-year low of 2.8% (May 2025), and credit growth continues to hold steady. With the rupee relatively stable and the current account deficit under control, India’s macroeconomic foundations appear well-anchored.
However, the road ahead isn’t without bumps. Global growth remains sluggish, dragged by prolonged Fed policy uncertainty, rising tariffs, and geopolitical strains. These external risks have begun to weigh on export-oriented sectors, delaying new private investments. The manufacturing sector remains uneven, and despite policy support, private capex is yet to pick up meaningfully.
In response, the RBI’s surprise 50 bps rate cut and 100 bps CRR reduction in June signal a clear pivot toward pro-growth policy. These steps, combined with higher public infrastructure spending and a likely rural recovery, are expected to support momentum in the coming quarters.
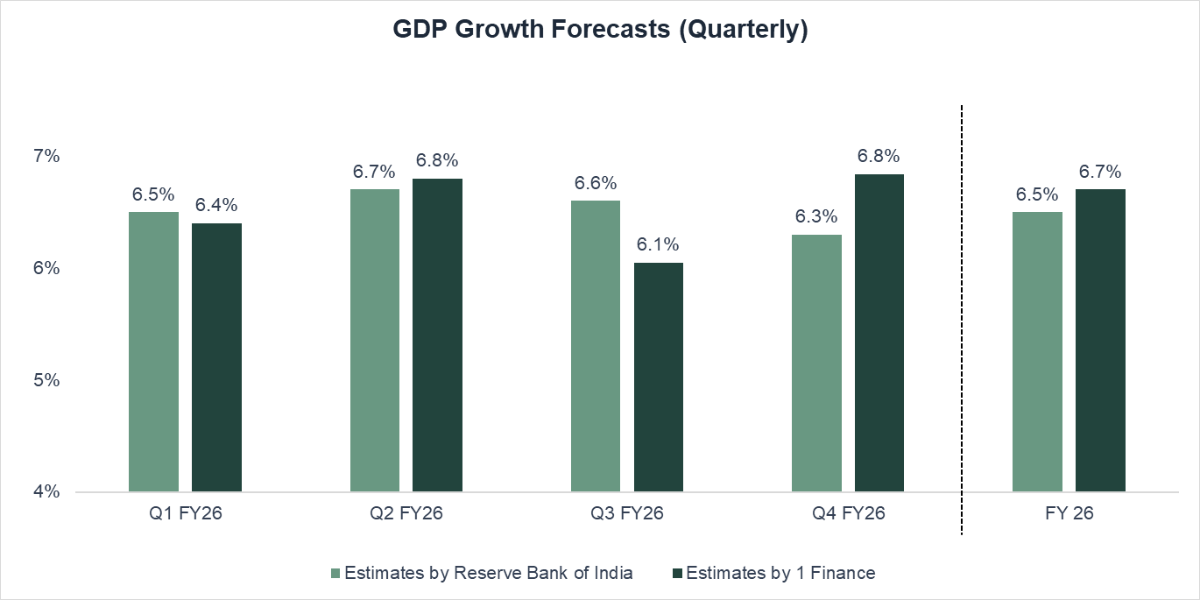
In light of these mixed signals, 1 Finance has marginally revised its FY26 GDP forecast to 6.7% from 6.8%. While this marks a modest downgrade, it still reflects confidence in India’s structural strength, making it one of the few major economies projected to grow above 6%.
Despite this, India remains a bright spot globally, benefiting from macro stability, policy continuity, and a services-led growth cushion. The challenge now lies in sustaining this trajectory while staying vigilant on external risks.
Recommended for you
Readers also explored

India’s Macroeconomic Outlook for 2025: Embracing Recovery and Global Shifts

World GDP Breakdown 2025: Who Powers the Global Economy?
A Health Check on India’s Macro Fundamentals
The 1 Finance Sub-Indices offer a ground-level view of how India’s economy is holding up under pressure. Here's how the economy is tracking across major dimensions as of May 2025:
| Service Sector Activity 👍 | Latest Month | Vs. Last Year | Vs. Last Month |
|---|---|---|---|
| The services sector is expected to maintain its growth trajectory, supported by sustained domestic demand and international orders. | 76.8 | +39.1% | +0.8% |
| Industrial Sector Performance 👎 | Latest Month | Vs. Last Year | Vs. Last Month |
|---|---|---|---|
Ongoing global economic conditions, trade policies, and domestic industrial reforms will play a crucial role in shaping the industrial sector's performance in the coming months. | 53 | -25.8% | -4.2% |
| Agriculture Output 👍 | Latest Month | Vs. Last Year | Vs. Last Month |
|---|---|---|---|
| The agriculture industry will likely maintain its strong growth rate, aided by favourable weather and government support. | 52.3 | +8.1% | -1.1% |
| Equity Market Optimism 👍 | Latest Month | Vs. Last Year | Vs. Last Month |
|---|---|---|---|
| The RBI’s rate cuts and ample liquidity are expected to sustain positive market sentiment, supporting further gains in equities. | 67 | -10.2% | +9.3% |
| Global Economic Impact 👎 | Latest Month | Vs. Last Year | Vs. Last Month |
|---|---|---|---|
| India is projected to remain the fastest-growing major economy in 2025-26, with growth supported by domestic consumption, policy reforms, and ongoing fiscal consolidation, even as global growth slows to its lowest pace since 2008. | 57.1 | +19.5% | +11.5% |
| Financial Sector Soundness 👍 | Latest Month | Vs. Last Year | Vs. Last Month |
|---|---|---|---|
| While RBI’s rate cuts and CRR reductions aim to ease liquidity, transmission to borrowers remains uneven; credit growth is expected to gradually recover as lending rates fall. | 70.4 | +14.1% | -1.3% |
*Data as of May 2025, hence growth comparisons are for May 2024 for Y-o-Y and April 2025 for M-o-M growth comparison.
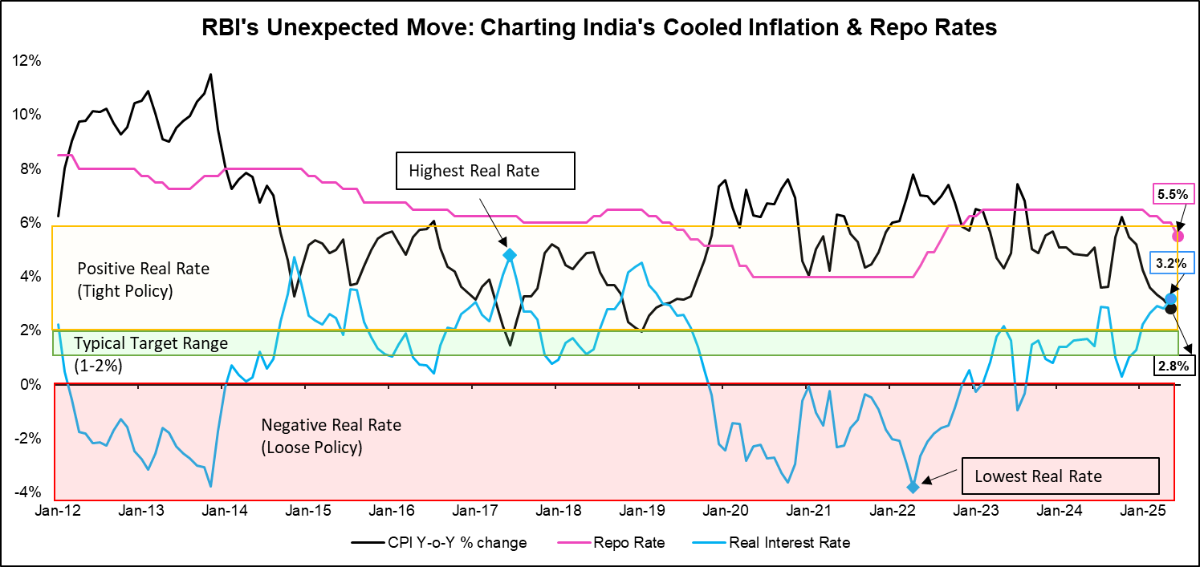
The Surprise Rate Cut: Triggered by Falling Inflation and Liquidity Infusion
In June 2025, the RBI surprised markets with a sharp 50-bps repo rate cut and a 100-bps CRR reduction, shifting its stance to Neutral. Banking system liquidity remains in surplus, with the LAF balance at ₹2.9 trillion as of June. The phased CRR cut is expected to inject an additional ₹2.5 trillion in primary liquidity by December 2025, supporting credit growth. While aimed at boosting growth, the move also reflects concern over weak private capital expenditure.
Data as of June 30, 2025
Private capex remains muted despite improved liquidity. Sectors like housing and autos haven’t rebounded as expected, and corporate data shows little appetite for reinvestment. The ratio of private capex to net operating margins remains at historic lows, while corporate debt growth has stagnated. Companies are favouring dividends and equity investments over capacity expansion.
Globally, geopolitical risks and tariff uncertainties continue to weigh on long-term investment decisions. Against this backdrop, the RBI’s Neutral stance allows flexibility, neither signalling further cuts nor ruling them out.
Going ahead, a small 25-bps cut in FY26 could be on the table. However, rate hikes are unlikely, given inflation is below target and real rates are positive. Only if growth needs support or a fall in inflation below 2% might warrant deeper cuts.
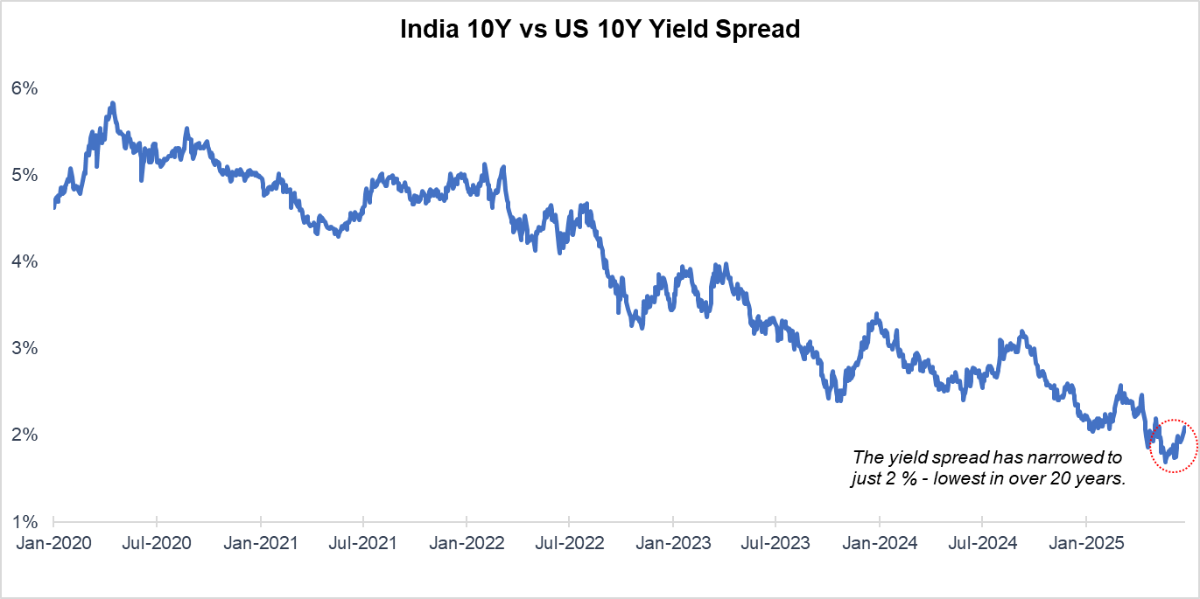
India- U.S. Yield Spread at Multi-decade Lows
In June 2025, the yield spread between India’s and the U.S.’s 10-year bonds narrowed to just around 2%, its lowest level in over two decades. The narrowing spread reflects diverging policy directions. While U.S. yields remain elevated as inflation stays stubborn and Fed cuts are delayed, India eased rates by 50 bps in June following a sharp drop in inflation to 2.8% in May 2025.
While this reflects macroeconomic confidence in India, the narrowing spread erodes the traditional carry trade advantage for foreign investors, potentially reducing their appetite for Indian debt. This could lead to softer FPI flows in the bond market despite India’s improving fiscal and current account metrics.
Data as of June 30, 2025.
For domestic investors, however, falling yields could boost bond prices and borrowing conditions. However, further tightening of the spread or a reversal will hinge on incoming global inflation data, policy signals from the Fed, and how India’s rate-cutting cycle evolves. For now, the market is treading a fine line between macro stability and external vulnerability.
Is the Equity-Gold Ratio Signalling a Turning Point?
The Equity-Gold Ratio compares how Indian equities (NIFTY 500) are performing relative to gold. When the ratio rises, equities are doing better. When it falls, it usually means investors are becoming cautious and moving towards gold.
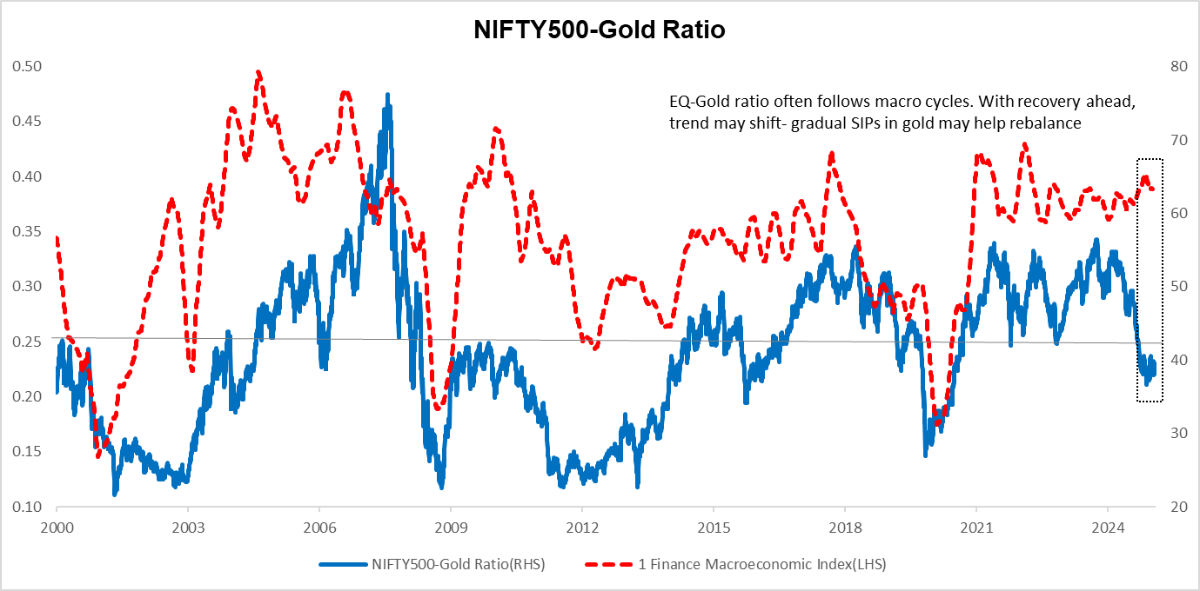
Data as of June 30, 2025.
In 2025, the ratio has been falling, showing that gold is outperforming equities as global uncertainty and market volatility remain high. This often happens during uncertain times, as seen during the 2008 financial crisis or the COVID-19 shock.
However, our 1 Finance Macroeconomic Index (1FMI) has started to stabilise, signalling that India’s recovery is well underway. If this continues, equity performance could pick up again, and the ratio may reverse.
Still, with the ratio not far from its historical lows, gold could continue to play a useful role in portfolios, especially if risks linger. A balanced approach between equity and gold may be the way forward.
Indian Equity Valuations Converging to Historical Norms
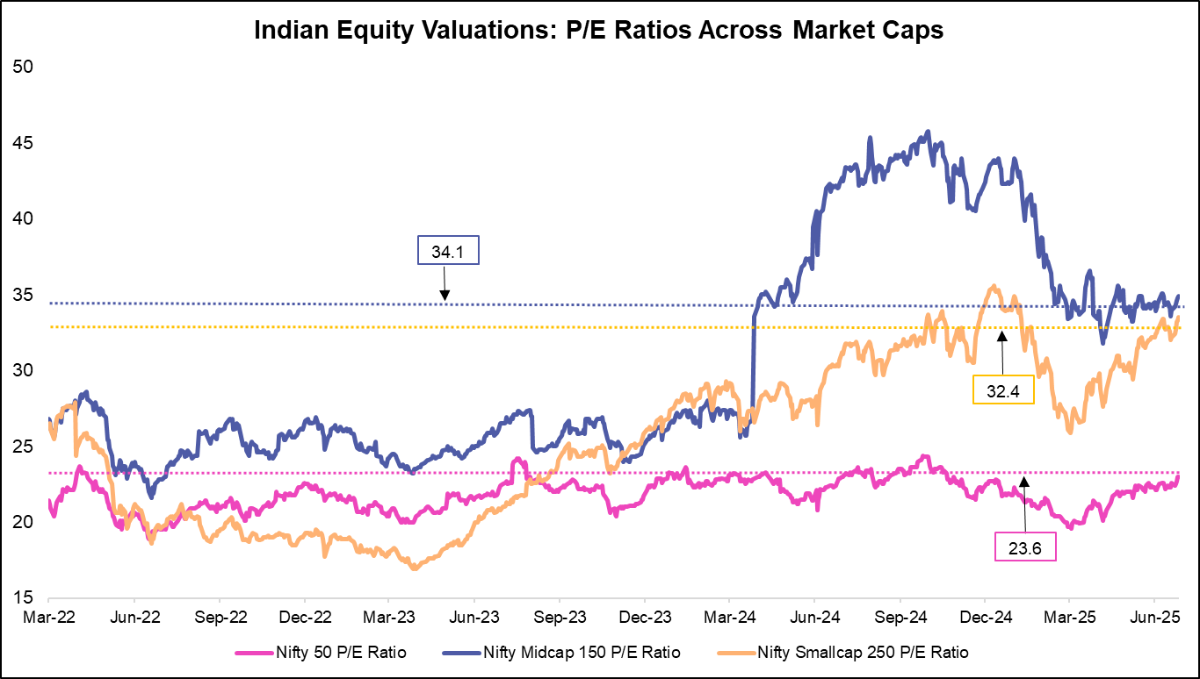
Data as of June 27, 2025.
[Note: Median P/E Ratios are calculated based on the last 10 years of data]
After a volatile run and extended valuations, Indian equity markets are now showing signs of stabilisation. Mid- and small-cap premiums have moderated, while large caps offer relative valuation comfort. This has brought the broader market closer to its long-term median price-to-earnings ratios, improving the risk-reward balance for investors.
This reversion coincides with a notably supportive macro environment. The RBI’s surprise 50 bps rate cut and 100 bps CRR reduction in June 2025, paired with inflation cooling to a six-year low of 2.8% (May 2025), marks a clear shift towards pro-growth policy.
Corporate profitability is also surging. The Corporate Profit-to-GDP ratio for Nifty 500 firms has reached 4.7%, approaching the 2008 peak of 5.2%, driven by a significant increase in aggregate profits, from ₹4 lakh crore in 2020 to ₹16 lakh crore in 2025. Including all listed and unlisted firms, this ratio could hit 7.5% in 2025, nearly matching the all-time high of 7.9%.
While domestic fundamentals are strong, challenges remain. Sluggish manufacturing, delayed private capex, rising protectionism, and persistent geopolitical tensions may weigh on sentiment. Still, India’s structural growth story continues to offer meaningful long-term wealth-creation opportunities.
A Closer Look at Global Equity Valuations: Who’s Priced for Potential?
In a world of shifting rate cycles, volatile geopolitics, and uneven earnings, valuation metrics offer a useful lens to assess how markets are pricing risk and opportunity.
Our latest look at global equity markets as of June 2025 reveals some compelling trends. By analysing key metrics such as Price-to-Earnings (PE) ratios, 5-year Price-to-Earnings Growth (PEG) ratios, Cyclically Adjusted PE (CAPE) ratios, Forward PE ratios, and Forward Price-to-Earnings Growth ratios across major indices, a clearer picture of outperforming regions emerges.
A Snapshot of Global Equity Valuations
| Country (Index) | 5-year PEG Ratio | Forward PEG Ratio | PE Ratio | CAPE Ratio | Forward PE Ratio |
|---|---|---|---|---|---|
| Brazil (Bovespa Index (Ibovespa) | 0.5x | 0.4x | 10.7x | 13.5x | 8.3x |
| Japan (Nikkei 225 Index) | 0.7x | 1.5x | 16.6x | 25.0x | 15.0x |
| South Korea (KOSPI Index) | 0.6x | 0.3x | 13.4x | 15.8x | 9.6x |
| United Kingdom (FTSE 100 Index) | 0.6x | 3.8x | 12.9x | 18.6x | 12.5x |
| United States (Large Cap) (S&P 500 Index) | 1.9x | 2.3x | 24.4x | 32.9x | 22.1x |
| Australia (S&P/ASX 200 Index) | 2.6x | 34.9x | 19.5x | 21.2x | 19.4x |
| Malaysia (FTSE Bursa Malaysia KLCI Index ) | 1.7x | NA | 14.2x | 15.1x | NA |
| Mexico (S&P/BMV IPC Index ) | 0.8x | NA | 15.0x | 16.9x | NA |
| Singapore (STI Index ) | 3.4x | NA | 14.0x | 15.3x | NA |
| Turkey (BIST 100 Index ) | 0.3x | NA | 12.4x | 7.6x | NA |
What the data shows:
Among developed and emerging markets with a clear forward earnings outlook, Brazil, Japan, South Korea, and the UK stand out for their relatively attractive valuations. These markets not only offer lower PE and Forward PE multiples but also benefit from favourable macro tailwinds and improving investor sentiment.
- The UK, while still facing post-Brexit headwinds, is drawing interest due to low P/E levels, improved earnings forecasts, a weaker currency, and falling rates. Its higher CAPE, however, warrants some caution.
- Japan scores strongly due to supportive valuation metrics like Forward and 5-year PEG ratios, along with structural reforms, improved capital efficiency, a transition from deflation to inflation and rising M&A activity.
- Brazil benefits from strong 5-year PEG and Forward PE metrics, helped by a strong economy and gains from global supply chain realignment.
- South Korea’s valuations are bolstered by attractive PE and PEG ratios, with momentum around corporate governance, developed market status and stabilising macro factors.
On the higher valuation trend, the U.S. (S&P 500) appears expensive across most metrics, particularly the 5-year PEG and CAPE. The recent rally, largely driven by AI and tech mega-caps, has stretched valuations even as earnings remain uneven.
Australia (S&P/ASX 200 Index) also shows elevated valuations, with both its PE and Forward PEG ratios suggesting limited upside. Earnings expectations remain muted, while weak GDP growth and currency volatility—amplified by global trade tensions—warrant a more cautious stance.
Among countries without forward PEG data, Malaysia and Mexico emerge as undervalued outliers:
- Malaysia's valuations are supported by relatively low PE and steady macroeconomic conditions. Though the 5-year PEG is high, stable inflation, firm consumption, and a recovering export base offer longer-term comfort.
- Mexico benefits from nearshoring tailwinds, healthy FDI inflows, and macro stability. Its low PEG ratio and decent CAPE suggest there may still be value, particularly as inflation appears to be easing and unemployment remains low.
On the other hand, Turkey and Singapore appear less attractive from a valuation standpoint. Both exhibit elevated PE ratios, with Turkey's earnings declining sharply and Singapore’s growth remaining flat.
Across the Globe: Where Major Economies Stand in 2025
| Country | (-) View (+) | Comment | Debt (%GDP) |
|---|---|---|---|
| U.S. |  |
| 123% |
| China |  |
| 96% |
| Japan | |
| 235% |
| UK | |
| 101% |
| EU |  |
| 89% |
Risk Radar: What could go wrong?
| Risk Event | Event Description | Impact on Markets | Expected Direction of Impact |
|---|---|---|---|
| Global trade protectionism | Rise in tariffs, reshoring trends, and shipping disruptions reduce trade efficiency | Indian Auto & Textile Sector | ▼ |
| INR/USD | ▼ | ||
| Gold | ▲ | ||
| Middle East regional war | Escalation disrupts crude oil supply, raises risk sentiment globally | Crude oil (INR) | ▲ |
| Indian Oil Manufacturing Companies (OMCs) | ▼ | ||
| INR/USD | ▼ | ||
| Gold | ▲ | ||
| U.S.–U.S.-China tariff war | Fragmented global trade & investment reduce global growth prospects | FPI inflows | ▼ |
| Domestic Electronics Manufacturing | ▲ | ||
| Indian Govt. Bonds | ▲ | ||
| U.S. debt rollover concerns | Rising U.S. yields or a default scare trigger global risk aversion | INR/USD | ▼ |
| Indian IT Sector | ▼ | ||
| Indian Govt. Bonds | ▼ | ||
| Gold | ▲ | ||
| The yen carry trade unwinding | Rising Japanese yields trigger repatriation from EMs, causing capital outflows | Indian Large Cap Equities | ▼ |
| INR/USD | ▼ | ||
| FPI debt flows | ▼ | ||
| Manufacturing slowdown | Industrial production remains subdued amid weak demand and global headwinds | Employment | ▼ |
| Bank Credit Growth | ▼ | ||
| Indian Corporate Bonds | ▼ | ||
| Energy Demand | ▼ | ||
| Delay in private capex revival | Firms delay capacity expansion due to high borrowing costs or uncertainty | Indian Banks | ▼ |
| Infrastructure Demand | ▼ | ||
| Bank Liquidity | ▲ | ||
| Indian Real Estate | ▼ |
What’s Ahead?
As FY26 unfolds, India stands on steady ground. While global risks remain, strong domestic momentum and policy support could help turn today’s challenges into tomorrow’s growth opportunities.