India’s Quarterly GDP Growth
Steady but Slow
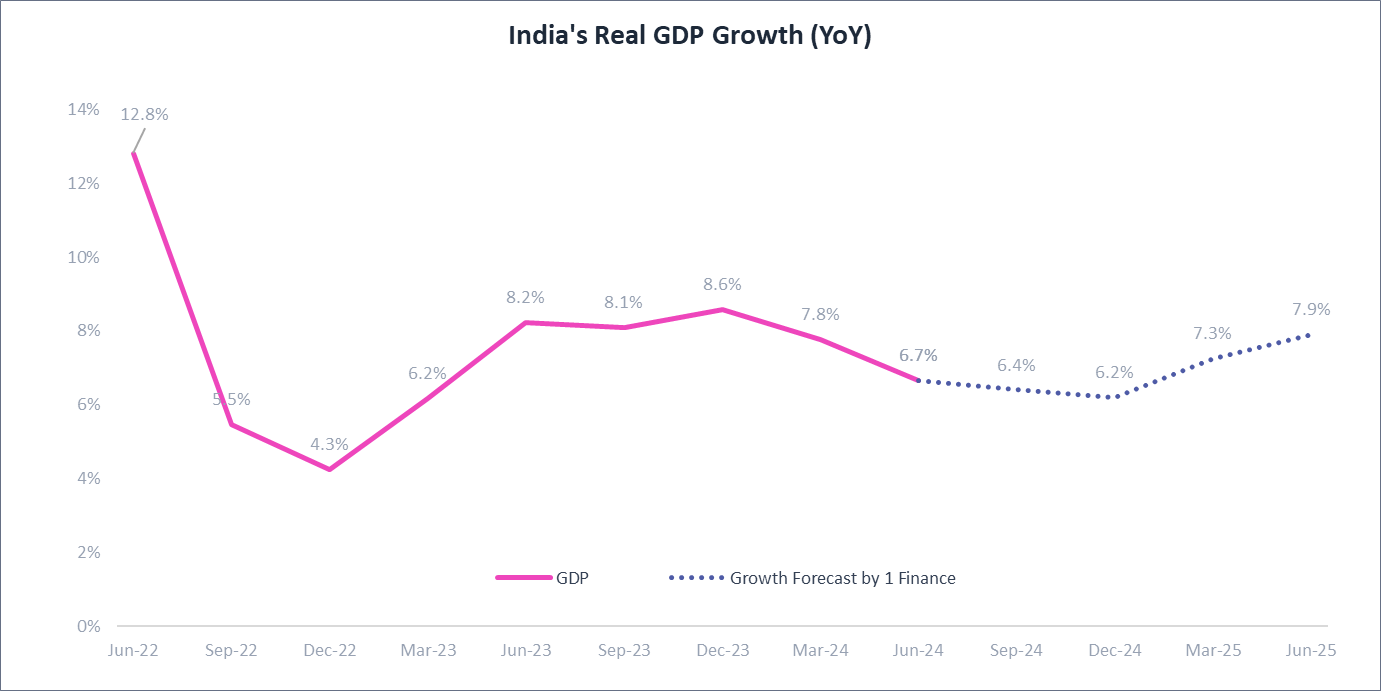
India's GDP growth slowed to 6.7% in the Jun-2024 quarter, largely due to weak agri sector growth (2.7%) caused by heatwaves and poor monsoon in 2023. Credible institutions' projections for GDP growth for FY2025 range between 6.5% and 7.2%, with 1 Finance estimating 6.7% growth.
Growth Outlook
- Short-Term - Expect a slight dip in growth in the September 2024 (6.4%) and December 2024 (6.2%) quarters.
- Recovery - Anticipated rebound in March 2025 (7.3%) and June 2025 (7.9%) quarters.
Positive Growth Catalyst
- Agriculture - Improved monsoon conditions.
- Investment - Increase in private capital expenditure.
- Consumption - Boosted by moderating inflation.
Potential Hurdles
- Rural Spending - Lags behind urban consumption.
- Global Volatility - Elections, monetary policy decisions and further escalation in geopolitical tensions could impact markets.
GDP: Gross Domestic Product
Record Market Cap to GDP
At 2007 Levels
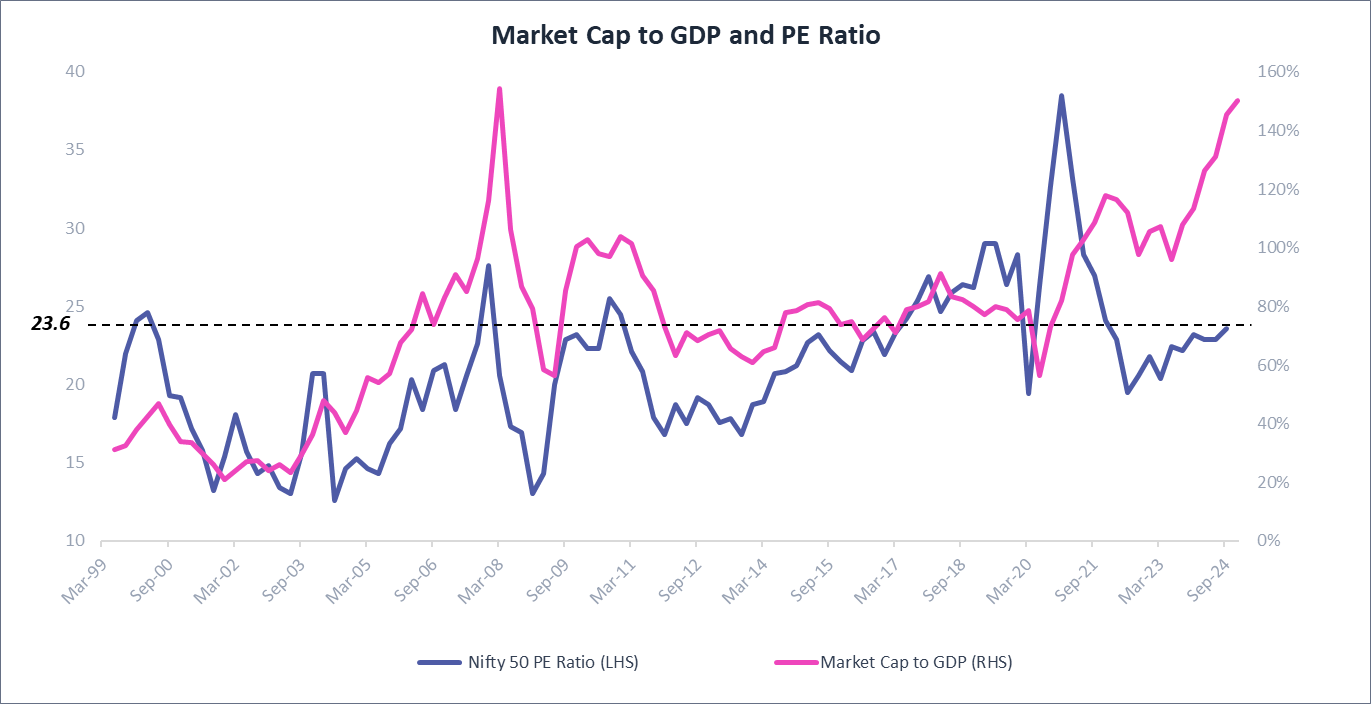
By August 2024, India's stock market capitalisation (Mcap) reached ₹464.4 trillion, a staggering 150% of GDP, a level not seen since 2007, indicating potential market overheating. The Nifty 50 P/E ratio currently stands at ~23.6 (as of Sept 13, 2024).
What's Driving This Growth?
- Mid and small-cap companies leading the charge
- Strong corporate earnings providing structural support
While earnings remain strong, valuations in certain sectors have become quite steep. This calls for a balanced approach to investing.
Smart Investing Strategies
- Trim mid and small-cap exposure - Their high valuations suggest caution
- Boost your fixed-income allocation - Consider FDs and debt funds for stability
- Tax-smart profit booking - If you're eyeing near-term goals, look into available tax exemptions
Recommended for you
Readers also explored

India's Growth Surge Meets Agri Hurdles

World GDP Breakdown 2025: Who Powers the Global Economy?
Varied Sectoral Valuations
Opportunities and Risks
Given the soaring Mcap-to-GDP ratio, we've taken a closer look at sector-wise valuations. To gauge market sentiments, we’ve compared the current Price-to-Earnings (P/E) ratios for most sectors and Price-to-Book (P/B) ratios for banks, with their historical values.
Our analysis reveals that the market's exuberance has led to a significant divergence between stock prices and earnings in several sectors. Notably, IT, FMCG, and Metals have seen their stock prices surge much faster than company earnings, indicating potential overvaluation.
Investment Strategies for the Current Market
- Exercise caution with expensive sectors and consider reducing exposure or avoiding new investments.
- For reasonably priced sectors, evaluate company fundamentals before making investment decisions.
- Avoid lump-sum investments; instead use SIPs to average out your entry points and mitigate timing risks.
Indian Equity Sector Valuations
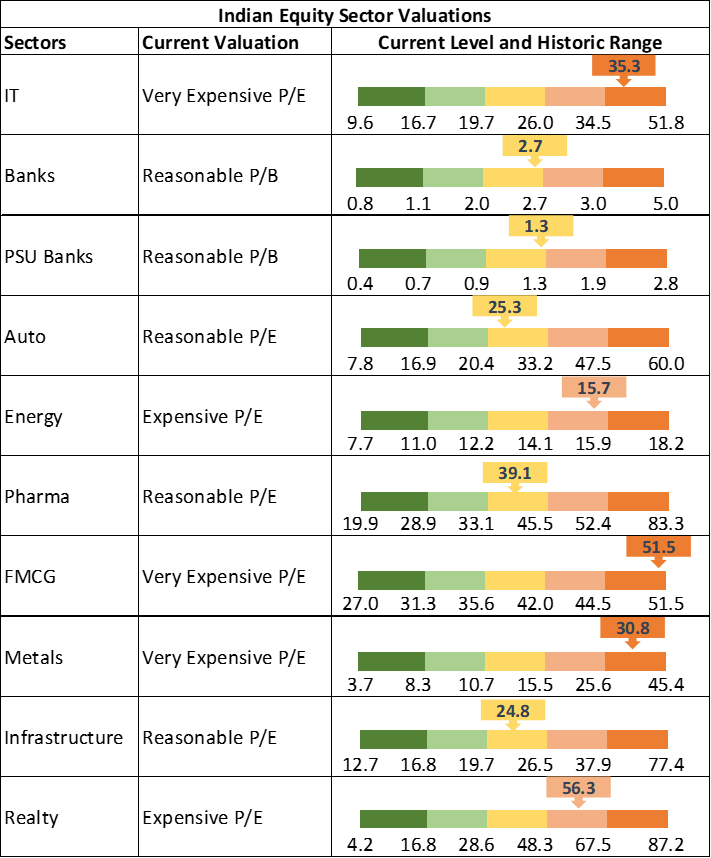
*Data as of Sep 13th, 2024. Unusual valuations due to earnings disruption during the COVID-19 pandemic were removed.
Price-to-Earnings (P/E), Price-to-Book (P/B)
Hiring Sentiment by Industry
Dec-24 Quarter Hiring Intentions
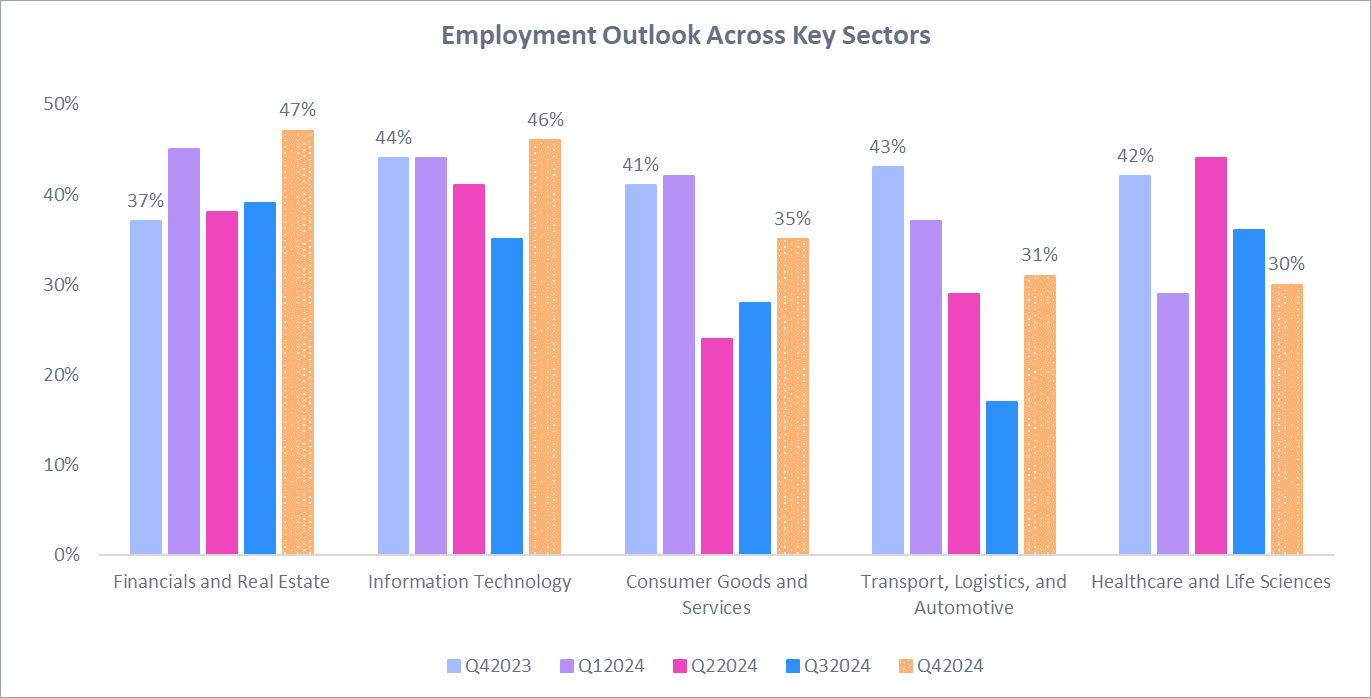
As we wrap up our monthly update, let's shift our focus to the employment landscape for the upcoming Dec-24 quarter. The ManpowerGroup Employment Outlook Survey, which captures hiring intentions of 3,150 Indian employers, offers valuable insights into the job market's direction.
Net Employment Outlook (NEO) Highlights
The NEO, calculated by subtracting the percentage of employers anticipating staff reductions from those planning to hire, reveals a nuanced picture across sectors:
- Financials and Real Estate Lead - With a robust 47% NEO, this sector tops the hiring chart, closely followed by Information Technology at 46%.
- Healthcare and Life Sciences Cool Down - The NEO for this sector is expected to dip to 30%, signalling a slowdown in hiring compared to previous quarters.
- Size Matters in Hiring - Companies with 250 or more employees show the most positive hiring sentiments.