India is ageing rapidly. The elderly population (60+) stands at ~150 million and is projected to reach 230 million by 2036, nearly 17% of the population. Life expectancy has risen from 60 in 2001 to over 70 today, while birth rates are declining.
Yet, most Indians lack a sustainable withdrawal plan for retirement. That’s where the Safe Withdrawal Rate (SWR) becomes essential.
In this edition, we present a deep dive analysis backed by Monte Carlo Simulations across age bands, asset allocation strategies, and market cycles.
Safe Withdrawal Rate: The Most Important Number for Retirement
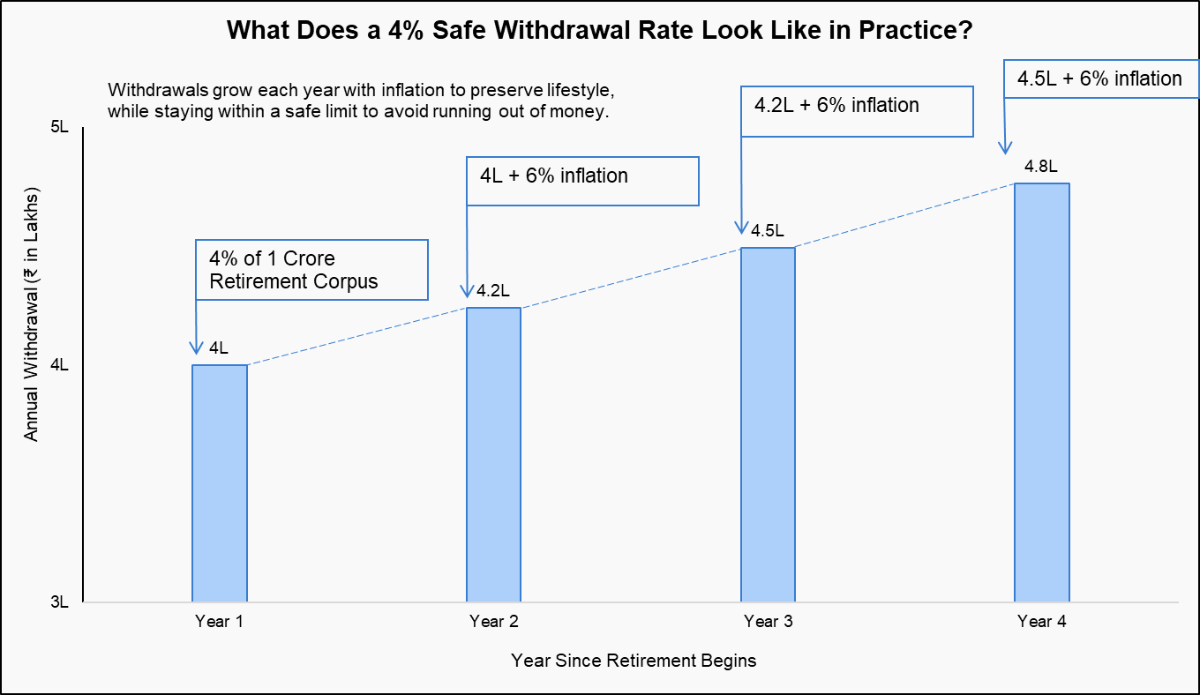
The Safe Withdrawal Rate (SWR) is the initial percentage withdrawn annually from a retirement portfolio. To maintain the purchasing power of these withdrawals over time, the amount is increased each year to match inflation. This means that after the first year, the withdrawal amount will be adjusted upwards based on the inflation rate.
Illustrative Example: With a 4% SWR on a ₹1 crore portfolio, the first year's withdrawal is ₹4 lakh. If inflation is 6%, the withdrawal in the following year will be ₹4.24 lakh.
Assumptions Used for Monte Carlo Simulation
→ Key Parameters Used in the Study
| Parameter | Details |
|---|---|
| Starting Retirement Age | 45, 50, 55, 60, 65 |
| Time Horizon | Projected until age 90 (i.e., 20-45 years depending on starting age) |
| Safe Withdrawal Rates (SWR) | 4%, 4.5%, 5%, 5.5%, 6% |
| Additional SWR (for ages 60 & 65 only) | 6.5%, 7% |
| Inflation Adjustment | Withdrawals increase by 6% annually to reflect cost-of-living inflation |
→ Asset Allocation Strategies Aligned to Different Investor Profiles
Five asset allocation strategies were used, each aligned to the most common Indian retiree behaviour:
| Asset Class | Conservative | Passive | Balanced | Risky | Only Equity |
|---|---|---|---|---|---|
| Equity | 5% | 5% | 20% | 40% | 100% |
| Real Estate | 10% | 30% | 20% | 20% | 0% |
| Passive Income Assets | 30% | 40% | 30% | 10% | 0% |
| Debt | 35% | 15% | 20% | 10% | 0% |
| Gold | 20% | 10% | 10% | 20% | 0% |
Recommended for you
Readers also explored

Inflation and Personal Finance: Protect Your Purchasing Power
India’s Unemployment Rate in 2025
→ Asset Class Proxies Used in the Study
The asset classes mentioned below were selected for the study. These specific proxies were chosen as they represent the primary characteristics of the respective asset classes.
| Asset Class | Proxy |
|---|---|
| Equity | NIFTY 500 |
| Real Estate | 1 Finance Housing Total Return Index |
| Gold | UTI Gold ETF (Primary Scheme) |
| Passive Income Assets | 1 Finance Housing Total Return Index |
| Debt |
|
Key Learnings from the Simulation Results
→ Balanced Portfolios Help Money Last Longer Without Increasing Risk
Balanced portfolios consistently offer higher corpus survival probabilities across a range of withdrawal strategies. Compared to conservative allocations, they allow for 0.25% to 0.50% higher sustainable withdrawal rates, enabling retirees to meet their lifestyle goals. This strength comes from diversification across equity, debt, real estate, and passive income assets, striking a steady balance between long-term growth and capital preservation.
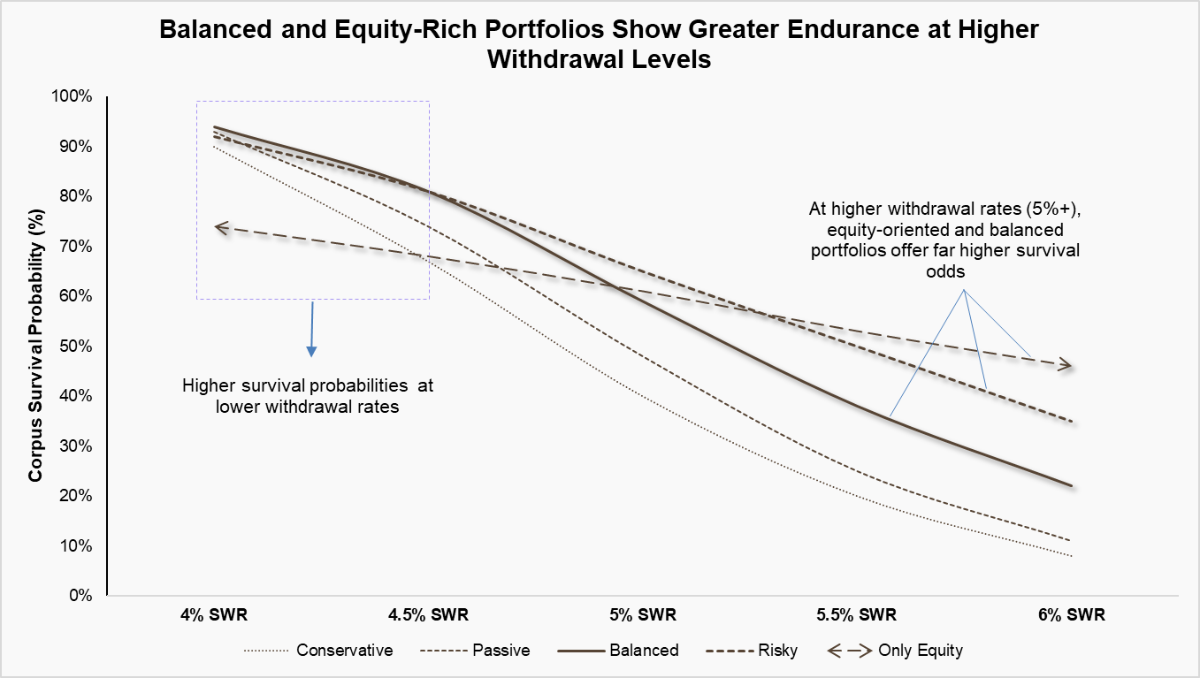
💡Corpus Survival Probability (CSP) is the percentage of simulated lifepaths where the retirement savings lasted until at least age 90. A higher CSP indicates a safer withdrawal strategy.
Why not an all-equity retirement portfolio?
A higher CSP of an all-equity portfolio may look appealing, but equity volatility can be dangerous. Early losses, combined with withdrawals, can cause lasting damage, known as the sequence of returns risk.
The chart below shows how two portfolios with identical returns perform differently based on timing. With ₹5 crore starting corpus and ₹20 lakh annual withdrawals (inflation-adjusted), the best-case grows over time, while the worst-case depletes by Year 13.
This highlights why all-equity portfolios are risky in retirement and why diversification and downside buffers are essential for long-term sustainability.
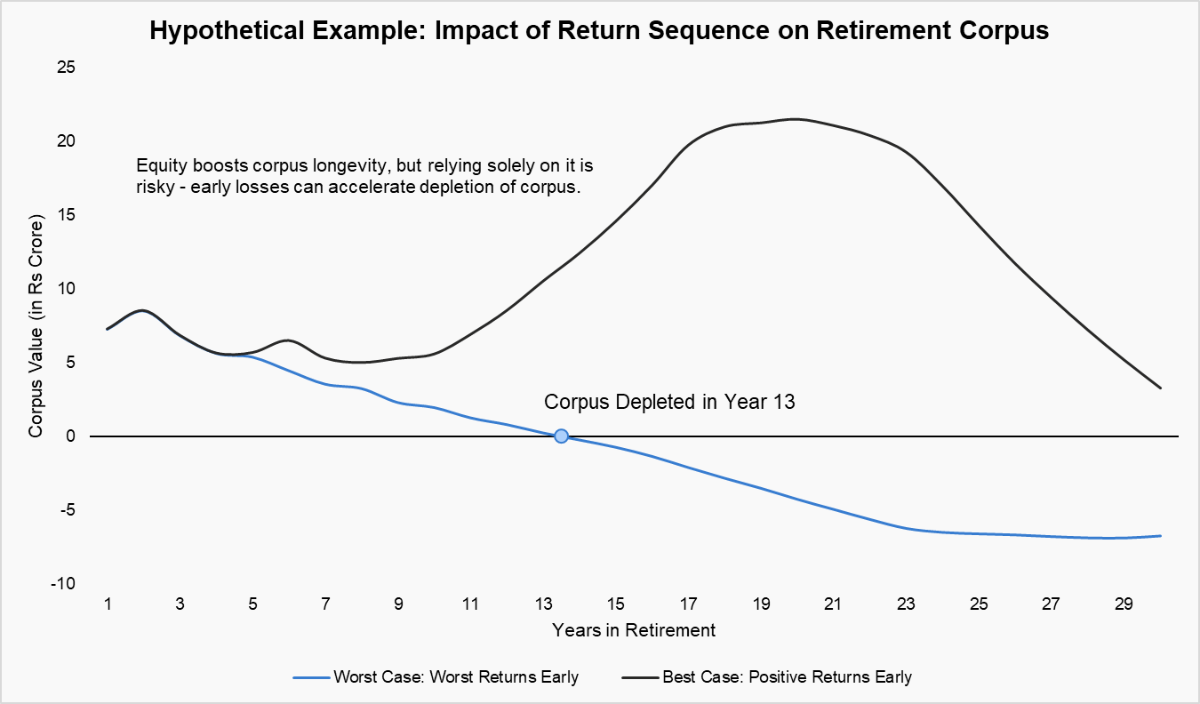
Note: This is a hypothetical example used to explain the concept of sequencing risk. The worst-case places the 5 worst returns first; the best-case places the 5 best returns first. Such sequences are implausible in reality, but they illustrate how the timing of returns can significantly impact retirement outcomes.
→ The Hidden Power of Retiring Later
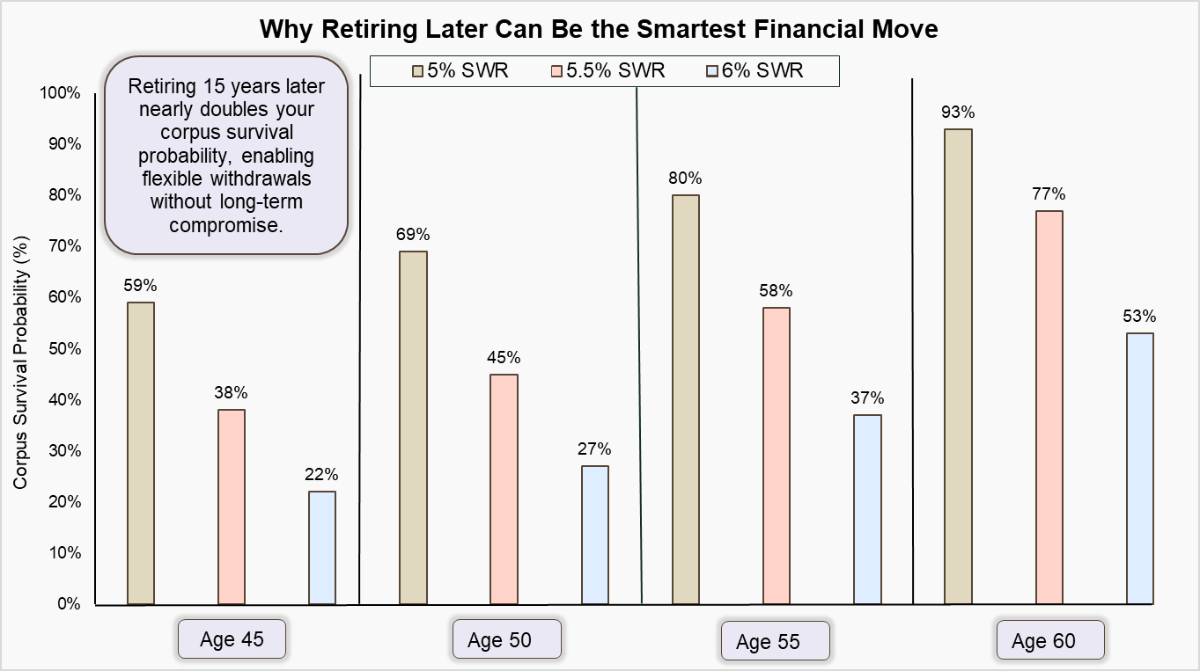
Delaying retirement by a decade or more can significantly improve corpus survival probabilities, particularly at higher withdrawal rates. The chart highlights how extended working years enhance both flexibility and financial longevity. Beyond the math, later retirement often supports stronger behavioural outcomes: continued engagement, social connection, and a sustained sense of purpose.
How to Use This Study?
→ Personalisation and Planning
| Insight | Implications for Retirement Planning |
|---|---|
| SWR ≠ One-Size-Fits-All | Tailor withdrawal rates to each individual’s age, life expectancy, and personal circumstances. |
| Longer Lifespans | Plan until age 90, as longevity risk is rising rapidly. |
| Annual Reviews Matter | Revisit the plan yearly. Life changes, so should withdrawal strategies. |
→ Portfolio Construction
| Insight | Implications for Retirement Planning |
|---|---|
| Balanced Portfolios Perform Best | Diversified portfolios provide a stable foundation, balancing growth with downside protection. |
| Sequencing Risk is Real, Equity-Heavy Portfolios Make It Worse | Equity is volatile, and overexposure in early retirement increases sequencing risk. If markets drop in the first year, ongoing withdrawals can lock in losses and shrink corpus longevity. |
| Older Age = Shorter Horizon = Higher SWR (But Don’t Overdo It) | Advanced age may justify slightly higher initial withdrawals due to fewer years to plan for. |
| Withdrawal Discipline Matters | Monte Carlo results show that 4%-4.5% withdrawal rates offer the highest sustainability over 25-30 years. |
| Plan for More Than Returns | Account for inflation, medical emergencies, lifestyle goals, etc. |
Conclusion
Most Indians focus on building their retirement corpus, but few plan how to withdraw it sustainably. With multiple financial priorities—family needs, health, lifestyle—the withdrawal strategy often gets overlooked. A survey by PGIM India Mutual Fund shows that 62% of Indians rely on insurance agents for advice on retirement planning, while only a few consult registered advisors. Yet, ongoing guidance, flexibility in withdrawals, and regular portfolio reviews are essential for lasting retirement success.


