By mid-2025, the UK economy is slowly emerging from a challenging period marked by elevated inflation, an after-effect of global energy shocks, disrupted supply chains, and sustained labour market pressures. These conditions were shaped by geopolitical upheavals and the reordering of trade flows, which left lasting imprints on prices and business costs. Growth remains muted, restrained by lingering global uncertainty and structural issues at home. While inflation has eased significantly from its peak, it still sits above the Bank of England’s target, keeping policymakers in a cautious, data-driven mode. Meanwhile, the FTSE-100 trades at a clear discount to major global indices, even as earnings remain near historic highs, fuelled by sectors such as energy, financials, and mining.
In this article, we will explore the performance and sector mix of the FTSE-100, examining why valuations remain compressed despite a solid earnings base. We will also assess the UK’s macroeconomic position and growth outlook. Finally, we will consider the implications of the newly signed India–UK Free Trade Agreement, its strategic importance, and how it could affect various stakeholders
Overview of the FTSE-100 Index
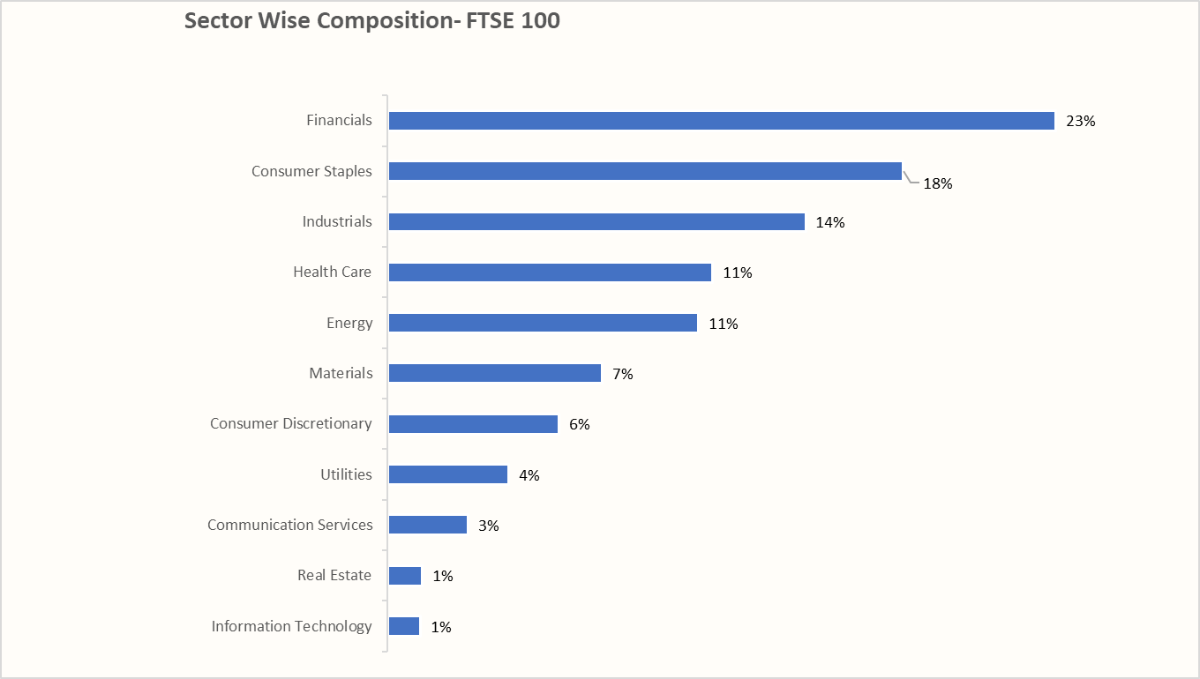
The FTSE 100 is the UK’s flagship stock market index, comprising the 100 largest companies listed on the London Stock Exchange by market capitalisation. The sector composition is heavily weighted toward Financials, Consumer Staples and Industrials. This structure reflects the FTSE’s global, income-oriented profile, with strong exposure to defensive sectors, commodities, and financial services, and comparatively little in high-growth tech. Such weighting supports dividend yields and global earnings resilience but limits participation in technology-led equity rallies.
A detailed sector-wise composition of the FTSE-100 Index is provided below:
Why is the FTSE-100 Undervalued ?
The UK’s FTSE-100 index appears undervalued based on an attractive 5-year PEG ratio, low P/E multiples, and improving earnings forecasts. Its corporate earnings remain robust and near record highs, supported by strong performances in key sectors, including energy, financials, and consumer staples.

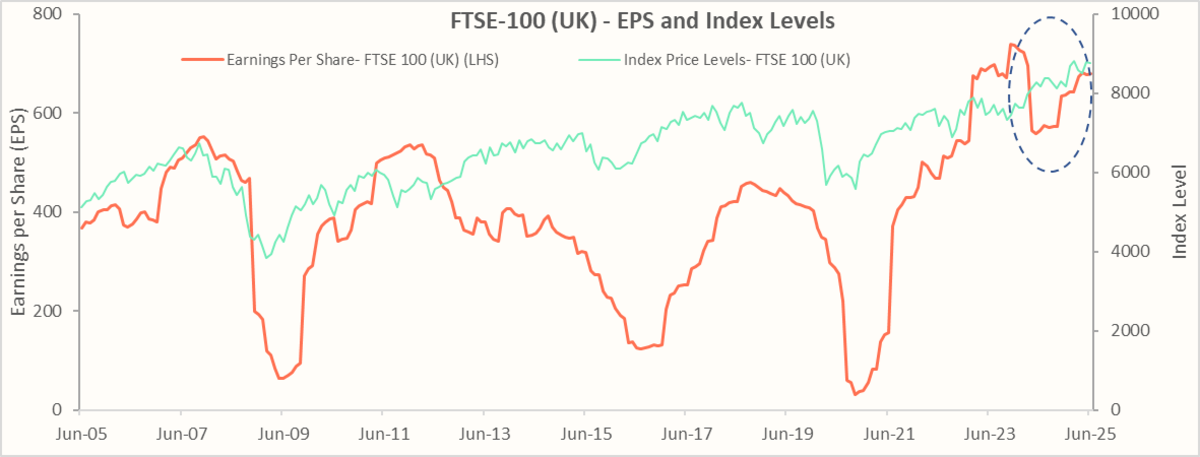
The chart below compares the Earnings per share for FTSE-100 stocks with the index price levels. After falling ~25% between Nov-23 and May-24, earnings per share (EPS), has recovered ~22% driven largely by a rebound in commodity-linked sectors, resilient banking margins, and disciplined cost control across several blue-chip names. On the other hand, the index price levels have seen only a small improvement of ~6%, leaving market valuations more attractive on a forward P/E basis than many global peers. This muted price response reflects a combination of factors: investor caution over the UK’s modest economic growth outlook, lingering concerns about persistent inflation, and a preference for high-growth markets elsewhere.
Next, let us examine the structure and the performance of the UK Economy in recent years
Recommended for you
Readers also explored

A Mid-Year Check: Whether India is in Flux
World GDP Breakdown 2025: Who Powers the Global Economy?
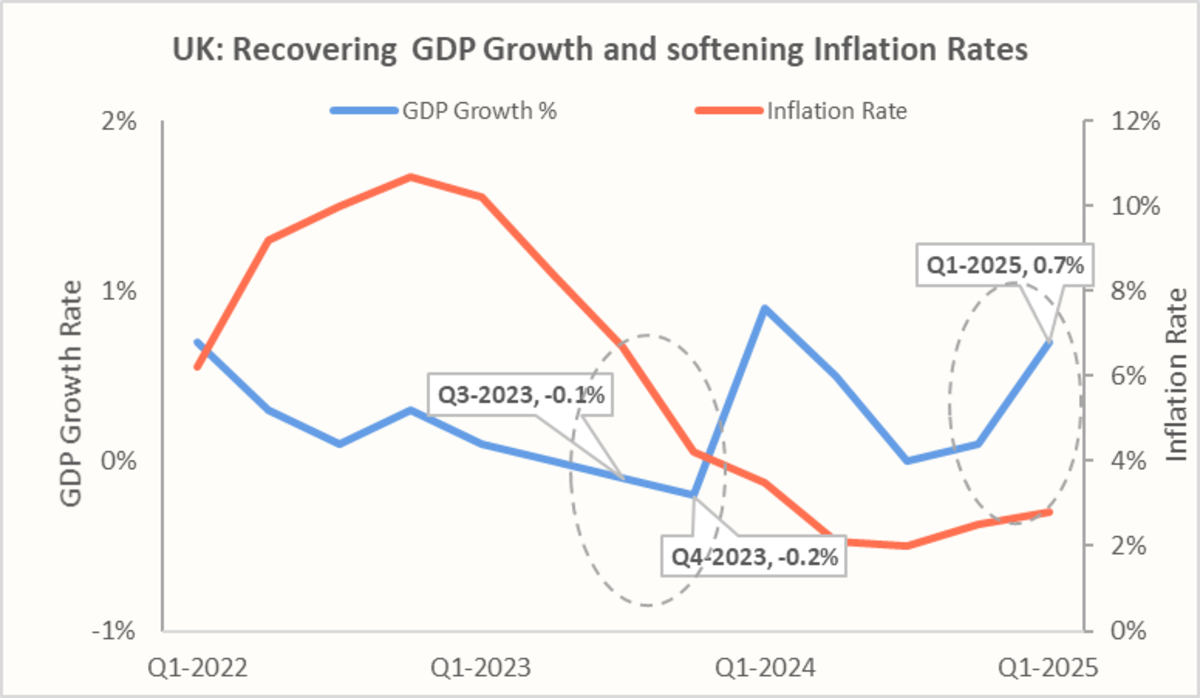
The UK Economy in recent years: A Brief Snapshot
In 2025, the United Kingdom is the world’s sixth-largest economy, with a nominal GDP of approximately £2.84 trillion ($3.8 trillion), representing about 2.4% of global GDP. GDP per capita stands at around £40,652 ($54,950). By sector, services dominate with roughly 79% of output, industry (including production and construction) contributes around 21%, and agriculture accounts for about 1%.
Politically, the UK operates under a stable parliamentary democracy with the Labour government elected in 2024, after a gap of 14 years. Political focus shifted toward pro-investment growth strategies, industrial policy, and renewable energy expansion. A summary of its key economic indicators over the recent years is summarised below:
- GDP growth has stayed sluggish, ~0.4% in 2023 and 1.1% in 2024, as high interest rates, weak business investment, stagnant productivity and post-Brexit trade frictions.
- The economy entered a recession in late 2023 due to persistently high inflation and structural weaknesses like low productivity growth, post-COVID economic scarring, Brexit effects, and underinvestment in infrastructure.
Inflation has declined from the 11.1% peak in Oct-22 as energy prices and supply bottlenecks unwound. It eased through 2023, but stayed high over 4.0% (Dec-23). In 2024, CPI reached around 2.5% (Dec-24), with services/wage pressures keeping it above the 2% target.
- The British pound (GBP) has strengthened modestly against major currencies in 2025 compared to 2024, when it saw a small decline, providing a tailwind for UK-listed multinationals by enhancing the value of overseas earnings when converted to the GBP.
- In 2025, GDP growth is expected to be around 1.2% reflecting subdued domestic demand, an easing (but still high) inflation and weak business investment.
- In Aug-25, the Bank of England (BoE) reduced rates by 25 bps to 4.0%, for the third time in 2025 after similar cuts in February and May. BoE faces the challenge of balancing the current inflation with weakening growth as wage pressures and sticky services inflation persist despite gradual disinflation.
- On the trade front, the UK continues to pursue its post-Brexit strategy of diversifying market access through trade negotiations with partners in the Gulf Cooperation Council, Canada, and Mexico and finalising the agreement with India.
The recently concluded India–UK Free Trade Agreement stands out for its scale and potential impact, while Trade policy remains geared toward securing tariff reductions, regulatory cooperation, and market access for goods, services, and investment, aiming to offset EU market frictions
India-UK Free Trade Agreement
The India-UK Free Trade Agreement (FTA) finalised in Jul-25 after extensive negotiations, marks a landmark deal between the world’s fourth and sixth largest economies. Currently, the bilateral trade stands at £44.1bn, with India’s exports to the UK reaching £26.6bn, up significantly over the past few years due to strong growth in goods like textiles, pharmaceuticals, and IT services alongside tariff easing. The UK Government forecasts a long-term GDP gain of £4.8bn annually (about 0.1% of GDP) and a boost in bilateral trade by approximately £25.5bn per year by 2040.
For India, the FTA offers zero-duty access to 99% of Indian exports to the UK, covering nearly 100% of trade value. The impact across sectors is summarised below:
- Automobiles & auto components: Increased access to the UK market will diversify the sector’s export demand beyond the US/EU, resulting in scale benefits and improved margins for India’s component makers
- Textiles & apparel: Zero-duty access for 99% of Indian exports lowers landed costs and aids price competitiveness against rivals in Bangladesh/Vietnam, supporting jobs in labour-intensive clusters.
- Gems & jewellery: Tariff elimination and smoother customs procedure will support value-added high-end jewellery exports, helping margins and working-capital cycles
- Leather & footwear: Duty-free entry reduces volatility from small margins and price-sensitive orders; encourages scale investments in compliant, higher-value product lines
- Engineering goods & machinery components: This sector forms a large share of Indian exports ( sits here; zero-duty access and clearer rules of origin support multi-year capex contracts and aftermarket parts.
- Chemicals & Generic Pharmaceuticals: Lower tariffs and improved regulatory cooperation is likely to shorten the time-to-market and improve predictability for bulk drugs/formulations
- Agri & marine: Duty-free quotas and streamlined sanitary and phytosanitary (SPS) and technical barriers to trade (TBT) processes (where applicable) will help seasonal shipments and price discovery for such products, stabilising farmer/exporter incomes
Furthermore, concerning services, the following provisions will enable improved mobility, higher penetration and increased employment opportunities for skilled professionals in the services sector:
- Business visitors, investors, intra-corporate transferees, contractual service suppliers, and independent professionals benefit from clearer entry routes and stays
- Mutual recognition of professional qualifications (MRAs), which shall enable/fast-track MRAs within defined timelines, easing market entry for architects, accountants, nurses, etc.
- Equal treatment & regulatory dialogue for UK banks/finance companies and pathways for recognition of qualifications—reducing non-tariff frictions.
- Wider services impact for India: IT/consulting/engineering firms gain from simplified mobility plus recognition, enabling on-site work and higher-value contracts; cultural and wellness professionals (e.g., chefs, musicians, yoga instructors) see easier short-term movement
For the UK, gains from tariff reduction are expected in sectors such as Wines & spirits (tariff reduction expected from 150% to 40%), Automobiles (tariff reduction to 10%), Machinery and advanced manufacturing, and Financial & legal services.
Conclusion
To conclude, we have looked at the current UK economic landscape, which offers a blend of cyclical recovery potential and structural opportunities. While the UK faces headwinds from slower GDP growth and post-Brexit trade adjustments, valuations in the FTSE-100 remain notably attractive, trading below historical averages and offering higher dividend yields than many developed market peers.
The India–UK Free Trade Agreement is poised to enhance bilateral trade flows by reducing tariffs, easing market access, and creating a more predictable regulatory framework. For Indian exporters, this could mean competitive advantages in sectors such as textiles, pharmaceuticals, and IT services, while importers may benefit from cheaper access to British machinery, spirits, and high-value consumer goods. From an investment standpoint, stronger trade ties can bolster corporate earnings visibility for Indian companies with UK exposure and improve cross-border capital flow prospects.
In essence, a combination of FTSE-100 undervaluation, potential UK economic stabilisation, and the structural trade tailwinds from the FTA could position the UK as a strategic diversification play in Indian portfolios—offering both value-driven and policy-supported upside.


