Introduction
“The Nifty 50, the flagship index of the National Stock Exchange of India Ltd. (NSE), tracks the performance of fifty of the largest and most actively traded stocks across various sectors.” As of September 3, 2025, the Nifty 50 is trading at 24,715.
Significance of Nifty 50
The Nifty 50 index serves as a key benchmark for investors, analysts, and fund managers to assess the performance of India’s blue-chip companies. Comprising 50 of the most liquid and prominent stocks on the NSE, the Nifty 50 captures approximately 66% of the exchange’s float-adjusted market capitalisation. By offering a comprehensive view of the Indian stock market, it effectively represents the main facets of the country’s economy. Since April 1996, investment managers have relied on the Nifty 50 for benchmarking, creating index funds, and trading index-based derivatives. It provides a streamlined way to gain exposure to the Indian market through a single, diversified portfolio.
List of Nifty 50 Companies
| Sr No. | Company Name | Symbol | Industry | Weight (%) |
|---|---|---|---|---|
| 1 | Adani Enterprises Ltd. | ADANIENT | Metals & Mining | 0.56 |
| 2 | Adani Ports and Special Economic Zone Ltd. | ADANIPORTS | Services | 0.90 |
| 3 | Apollo Hospitals Enterprise Ltd. | APOLLOHOSP | Healthcare | 0.67 |
| 4 | Asian Paints Ltd. | ASIANPAINT | Consumer Durables | 0.97 |
| 5 | Axis Bank Ltd. | AXISBANK | Financial Services | 2.72 |
| 6 | Bajaj Auto Ltd. | BAJAJ-AUTO | Automobile and Auto Components | 0.79 |
| 7 | Bajaj Finance Ltd. | BAJFINANCE | Financial Services | 2.09 |
| 8 | Bajaj Finserv Ltd. | BAJAJFINSV | Financial Services | 0.94 |
| 9 | Bharat Electronics Ltd. | BEL | Capital Goods | 1.22 |
| 10 | Bharti Airtel Ltd. | BHARTIARTL | Telecommunication | 4.65 |
| 11 | Cipla Ltd. | CIPLA | Healthcare | 0.78 |
| 12 | Coal India Ltd. | COALINDIA | Oil Gas & Consumable Fuels | 0.76 |
| 13 | Dr. Reddy's Laboratories Ltd. | DRREDDY | Healthcare | 0.69 |
| 14 | Eicher Motors Ltd. | EICHERMOT | Automobile and Auto Components | 0.67 |
| 15 | Eternal Ltd. | ETERNAL | Consumer Services | 1.91 |
| 16 | Grasim Industries Ltd. | GRASIM | Construction Materials | 0.93 |
| 17 | HCL Technologies Ltd. | HCLTECH | Information Technology | 1.39 |
| 18 | HDFC Bank Ltd. | HDFCBANK | Financial Services | 13.71 |
| 19 | HDFC Life Insurance Company Ltd. | HDFCLIFE | Financial Services | 0.72 |
| 20 | Hero MotoCorp Ltd. | HEROMOTOCO | Automobile and Auto Components | 0.49 |
| 21 | Hindalco Industries Ltd. | HINDALCO | Metals & Mining | 0.88 |
| 22 | Hindustan Unilever Ltd. | HINDUNILVR | Fast Moving Consumer Goods | 1.99 |
| 23 | ICICI Bank Ltd. | ICICIBANK | Financial Services | 9.41 |
| 24 | ITC Ltd. | ITC | Fast Moving Consumer Goods | 3.42 |
| 25 | IndusInd Bank Ltd. | INDUSINDBK | Financial Services | 0.47 |
| 26 | Infosys Ltd. | INFY | Information Technology | 4.84 |
| 27 | JSW Steel Ltd. | JSWSTEEL | Metals & Mining | 0.89 |
| 28 | Jio Financial Services Ltd. | JIO FIN | Financial Services | 0.96 |
| 29 | Kotak Mahindra Bank Ltd. | KOTAKBANK | Financial Services | 2.59 |
| 30 | Larsen & Toubro Ltd. | LT | Construction | 3.80 |
| 31 | Mahindra & Mahindra Ltd. | M&M | Automobile and Auto Components | 2.52 |
| 32 | Maruti Suzuki India Ltd. | MARUTI | Automobile and Auto Components | 1.47 |
| 33 | NTPC Ltd. | NTPC | Power | 1.41 |
| 34 | Nestle India Ltd. | NESTLEIND | Fast Moving Consumer Goods | 0.72 |
| 35 | Oil & Natural Gas Corporation Ltd. | ONGC | Oil Gas & Consumable Fuels | 0.83 |
| 36 | Power Grid Corporation of India Ltd. | POWERGRID | Power | 1.17 |
| 37 | Reliance Industries Ltd. | RELIANCE | Oil Gas & Consumable Fuels | 8.39 |
| 38 | SBI Life Insurance Company Ltd. | SBILIFE | Financial Services | 0.74 |
| 39 | Shriram Finance Ltd. | SHRIRAMFIN | Financial Services | 0.79 |
| 40 | State Bank of India | SBIN | Financial Services | 2.73 |
| 41 | Sun Pharmaceutical Industries Ltd. | SUNPHARMA | Healthcare | 1.64 |
| 42 | Tata Consultancy Services Ltd. | TCS | Information Technology | 2.76 |
| 43 | Tata Consumer Products Ltd. | TATACONSUM | Fast Moving Consumer Goods | 0.62 |
| 44 | Tata Motors Ltd. | TATAMOTORS | Automobile and Auto Components | 1.24 |
| 45 | Tata Steel Ltd. | TATASTEEL | Metals & Mining | 1.16 |
| 46 | Tech Mahindra Ltd. | TECHM | Information Technology | 0.83 |
| 47 | Titan Company Ltd. | TITAN | Consumer Durables | 1.23 |
| 48 | Trent Ltd. | TRENT | Consumer Services | 0.99 |
| 49 | UltraTech Cement Ltd. | ULTRACEMCO | Construction Materials | 1.30 |
| 50 | Wipro Ltd. | WIPRO | Information Technology | 0.63 |
Source: NSE
Recommended for you
Readers also explored

Balancing Slowdowns and Sectoral Strength

India’s Unemployment Rate in 2025
Sectoral Breakdown of Nifty 50 Index
The Nifty 50 index is constructed based on free-float market capitalisation, meaning companies with larger market capitalisations have a greater influence on the index. Companies from financial services, technology, and consumer-driven industries have larger market capitalisations, contributing to their dominance in the index.
Nifty 50 Index Sector Weight
| Sector | Weightage (%) |
|---|---|
| Financial Services | 36.82 |
| Information Technology | 10.51 |
| Oil Gas & Consumable Fuels | 9.90 |
| Automobile and Auto Components | 7.79 |
| Fast Moving Consumer Goods | 6.95 |
| Telecommunication | 4.65 |
| Construction | 3.82 |
| Healthcare | 3.75 |
| Metals & Mining | 3.48 |
| Consumer Services | 3.03 |
| Power | 2.53 |
| Consumer Durables | 2.38 |
| Construction Materials | 2.31 |
| Capital Goods | 1.20 |
| Services | 0.88 |
Source: NSE
Market Performance and Stock Returns of Top 10 Nifty 50 Companies
HDFC Bank
HDFC Bank holds the highest weightage in the Nifty 50, highlighting its dominance in the financial services sector. Known for its consistent performance, HDFC Bank remains a leader in retail and corporate banking.
ICICI Bank
ICICI Bank is a leader in private banking, with strong loan growth and improved digital banking services. Its diversified revenue base ensures resilience during volatile market conditions, driven by improved profitability and asset quality.
Reliance Industries Ltd
Reliance Industries maintains its position as a diversified conglomerate, benefiting from its strong presence in energy, retail, and telecom sectors. However, global energy price fluctuations have influenced its stock performance.
Infosys Ltd
Infosys, a global IT services leader, capitalises on growing demand for digital transformation and AI-driven solutions. Its performance aligns with the resilience of India’s IT sector.
Bharti Airtel Ltd
Bharti Airtel shares 4.65% weightage and has outperformed most of its peers, driven by the rollout of 5G services and rising average revenue per user.
Larsen & Toubro Ltd
L&T has benefited from the government’s infrastructure push and increased capital expenditure. Its order book and execution capabilities remain strong.
ITC Ltd
ITC’s diversified portfolio in FMCG, cigarettes, and hotels contributes to its stable performance. Its expansion in agribusiness and consumer goods drives its growth.
Tata Consultancy Services Ltd
TCS, with a weightage of 2.76%, continues to lead the IT sector with its innovative technology solutions.
State Bank of India
SBI, with a weightage of 2.73%, remains a key public sector bank with significant rural and corporate loan growth.
Axis Bank Ltd
Axis Bank’s weightage of 2.72% reflects its growing presence in retail and corporate banking. Despite sectoral challenges. The bank is demonstrating a clear path to continued success by showcasing steady progress.
This seasonality analysis provides valuable insights into HDFC Bank's historical market behavior. Use this tool to explore similar patterns in other companies and gain a deeper understanding of their market performance.
Performance metrics for Nifty 50 Companies
Evaluating the performance of Nifty 50 stocks involves analysing several key metrics to understand a company’s profitability, growth potential, and value for investors. Below is a breakdown of important performance metrics and their implications:
Return on Equity (ROE):
Indicates how efficiently a company uses shareholder equity to generate profits. High ROE stocks like Nestle India (83%) demonstrate superior management efficiency and are often favoured by growth-oriented investors.
Price-to-Earnings (P/E) Ratio:
Measures the price investors are willing to pay for each unit of earnings. Companies with a low P/E, such as Coal India (7.2), may offer value investment opportunities, while high P/E stocks like Titan (88.65) reflect market confidence in future growth. The Nifty 50 P/E ratio is a valuation metric that measures the price investors are willing to pay for every rupee of earnings that the Nifty 50 companies collectively generate. It's calculated by dividing the current market value of the Nifty 50 index by the total earnings of all the companies included in the index over a specific period.
Dividend Yield:
Shows the annual dividend return relative to the stock price. For income-focused investors, companies like Coal India (6.9%) offer steady dividend income, supplementing capital gains.
Return on Capital Employed (ROCE):
Measures profitability and efficiency in capital utilisation. High ROCE companies, such as Nestle India (95.7%), signal effective deployment of resources to maximise returns.
Price-to-Book Value (P/BV):
Indicates how the market values the company relative to its book value. A low P/BV, such as ONGC (0.9), may suggest undervaluation, while high P/BV stocks like Nestle India (57.3) reflect premium pricing due to market trust.
Growth-oriented investors might favour high ROE and P/E stocks, while conservative investors may prioritise high dividend yield and low P/BV ratios.
Key Metrics for Nifty 50 Companies
| Sr No. | Company Name | ROE (%) | P/E | Div Yield (%) | ROCE (%) | P/BV |
|---|---|---|---|---|---|---|
| 1 | Adani Enterprises Ltd. | 9.82 | 73.76 | 0.06 | 9.45 | 5.28 |
| 2 | Adani Ports and Special Economic Zone Ltd. | 18.76 | 25.39 | 0.52 | 13.80 | 4.63 |
| 3 | Apollo Hospitals Enterprise Ltd. | 18.42 | 71.82 | 0.25 | 16.64 | 13.74 |
| 4 | Asian Paints Ltd. | 20.59 | 64.04 | 0.97 | 25.72 | 12.71 |
| 5 | Axis Bank Ltd. | 16.30 | 11.73 | 0.09 | 7.11 | 1.75 |
| 6 | Bajaj Auto Ltd. | 22.77 | 33.69 | 2.28 | 28.06 | 7.28 |
| 7 | Bajaj Finance Ltd. | 19.22 | 33.61 | 0.47 | 11.35 | 6.04 |
| 8 | Bajaj Finserv Ltd. | 13.39 | 33.95 | 0.05 | 11.03 | 4.45 |
| 9 | Bharat Electronics Ltd. | 29.22 | 50.16 | 0.62 | 38.88 | 13.81 |
| 10 | Bharti Airtel Ltd. | 23.18 | 38.25 | 0.86 | 13.48 | 9.38 |
| 11 | Cipla Ltd. | 17.77 | 23.70 | 0.82 | 22.72 | 4.13 |
| 12 | Coal India Ltd. | 38.89 | 7.22 | 6.83 | 48.04 | 2.41 |
| 13 | Dr. Reddy's Laboratories Ltd. | 17.96 | 18.55 | 0.63 | 22.69 | 3.11 |
| 14 | Eicher Motors Ltd. | 24.10 | 36.82 | 1.06 | 29.81 | 8.40 |
| 15 | Eternal Ltd. | 1.71 | 1044.63 | 0.00 | 2.66 | 10.35 |
| 16 | Grasim Industries Ltd. | 3.95 | 46.25 | 0.35 | 7.50 | 1.99 |
| 17 | HCL Technologies Ltd. | 25.00 | 23.34 | 3.71 | 31.61 | 5.70 |
| 18 | HDFC Bank Ltd. | 14.45 | 20.87 | 1.14 | 7.51 | 2.79 |
| 19 | HDFC Life Insurance Company Ltd. | 10.80 | 90.25 | 0.27 | 6.58 | 9.93 |
| 20 | Hero MotoCorp Ltd. | 23.06 | 21.36 | 3.08 | 30.34 | 5.56 |
| 21 | Hindustan Unilever Ltd. | 20.72 | 59.57 | 1.58 | 27.85 | 12.85 |
| 22 | Hindalco Industries Ltd. | 14.02 | 9.62 | 0.67 | 14.80 | 1.34 |
| 23 | ICICI Bank Ltd. | 17.89 | 19.00 | 0.78 | 7.87 | 3.20 |
| 24 | IndusInd Bank Ltd. | 4.15 | 50.53 | 2.17 | 6.49 | 0.93 |
| 25 | Infosys Ltd. | 28.83 | 22.42 | 2.90 | 37.50 | 6.44 |
| 26 | ITC Ltd. | 27.32 | 26.13 | 3.39 | 36.79 | 7.46 |
| 27 | Jio Financial Services Ltd. | 1.23 | 124.05 | 0.16 | 1.47 | 1.61 |
| 28 | JSW Steel Ltd. | 4.94 | 51.23 | 0.26 | 8.11 | 3.31 |
| 29 | Kotak Mahindra Bank Ltd. | 15.37 | 20.39 | 0.13 | 8.17 | 2.46 |
| 30 | Larsen & Toubro Ltd. | 16.55 | 31.89 | 0.94 | 14.49 | 5.07 |
| 31 | Mahindra & Mahindra Ltd. | 18.05 | 31.53 | 0.73 | 13.93 | 5.61 |
| 32 | Maruti Suzuki India Ltd. | 15.89 | 32.06 | 0.90 | 21.70 | 4.84 |
| 33 | Nestle India Ltd. | 83.02 | 78.41 | 1.10 | 95.66 | 57.26 |
| 34 | NTPC Ltd. | 12.13 | 13.50 | 2.52 | 9.95 | 1.74 |
| 35 | Oil & Natural Gas Corporation Ltd. | 10.63 | 8.22 | 5.16 | 12.04 | 0.87 |
| 36 | Power Grid Corporation of India Ltd. | 17.00 | 17.15 | 3.15 | 12.78 | 2.87 |
| 37 | Reliance Industries Ltd. | 8.40 | 24.59 | 0.40 | 9.69 | 2.19 |
| 38 | State Bank of India | 17.20 | 9.43 | 1.95 | 6.47 | 1.40 |
| 39 | SBI Life Insurance Company Ltd. | 15.13 | 73.74 | 0.16 | 16.88 | 10.25 |
| 40 | Shriram Finance Ltd. | 15.57 | 13.10 | 1.69 | 10.95 | 1.96 |
| 41 | Sun Pharmaceutical Industries Ltd. | 16.86 | 32.84 | 1.02 | 20.21 | 5.19 |
| 42 | Tata Consumer Products Ltd. | 7.01 | 81.69 | 0.75 | 9.16 | 5.34 |
| 43 | Tata Motors Ltd. | 28.08 | 11.85 | 0.87 | 19.97 | 2.23 |
| 44 | Tata Steel Ltd. | 3.89 | 43.57 | 2.16 | 8.83 | 2.28 |
| 45 | Tata Consultancy Services Ltd. | 52.38 | 22.86 | 1.93 | 64.63 | 11.91 |
| 46 | Tech Mahindra Ltd. | 14.62 | 32.39 | 2.98 | 18.56 | 5.40 |
| 47 | Titan Company Ltd. | 31.75 | 88.65 | 0.29 | 19.14 | 28.29 |
| 48 | Trent Ltd. | 30.40 | 125.98 | 0.09 | 30.71 | 36.55 |
| 49 | UltraTech Cement Ltd. | 9.29 | 54.42 | 0.60 | 10.89 | 5.37 |
| 50 | Wipro Ltd. | 16.59 | 19.34 | 2.41 | 19.51 | 3.15 |
Source: Screener
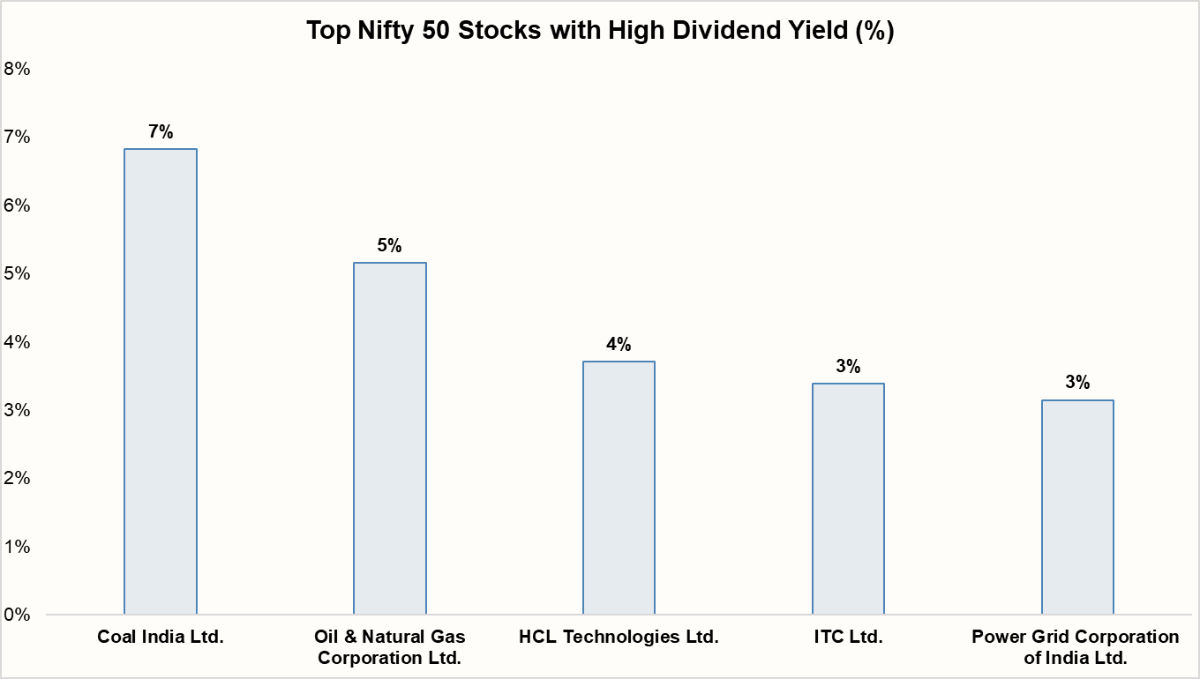
Top Nifty 50 Stocks with High Dividend Yield (%)
Dividend yield is an important metric for investors looking for steady income in addition to capital appreciation.
| Company’s Name | Dividend Yield (%) |
|---|---|
| Coal India Ltd. | 6.83 |
| Oil & Natural Gas Corporation Ltd. | 5.16 |
| HCL Technologies Ltd. | 3.71 |
| ITC Ltd. | 3.39 |
| Power Grid Corporation of India Ltd. | 3.15 |
Source: Screener
Conclusion
In conclusion, the Nifty 50 index serves as a crucial barometer of the Indian stock market. As the Indian economy continues to grow and mature, the composition of the Nifty 50 may also undergo significant changes. It will be fascinating to observe how this iconic index evolves in the years to come.