
The Index of Industrial Production (IIP) is one of India's most crucial macroeconomic indicators. It measures the short-term changes in the volume of production across India’s industrial sector. As an early indicator of economic performance, the IIP plays a significant role in shaping the industrial policy, fiscal and monetary policies and private investment decisions.
The Index of Industrial Production (IIP) in India has a long legacy, first introduced in 1950 to provide a consistent, high-frequency measure of the country’s industrial output. Initially limited in scope, the index has since expanded and undergone multiple base-year revisions (latest: 2011–12) to reflect evolving industrial structures and consumption patterns.
It is published monthly by the National Statistical Office (NSO) under the Ministry of Statistics and Programme Implementation (MoSPI). Like a Barometer, it helps measure the strengths and weaknesses within industries and provides early signals on economic cycles, aiding in timely policy responses.
Components of IIP
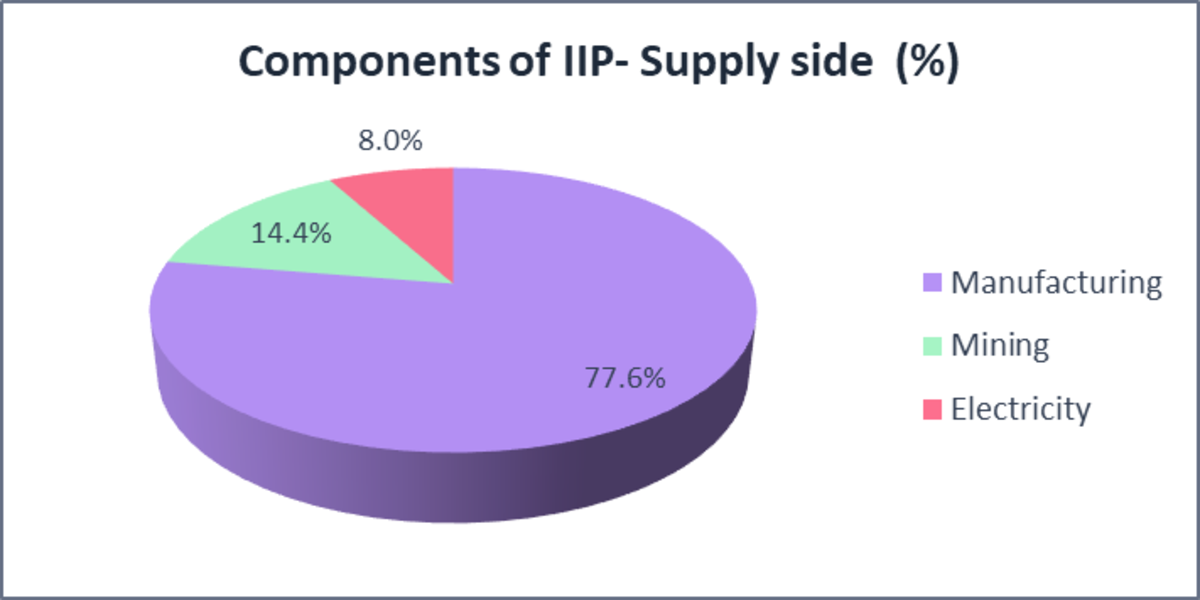
Supply-Side Classification of IIP (Sectoral)
IIP comprises of mining, manufacturing, and electricity sectors, with weights based on the Gross Value Added (GVA) in the base year. Each sector comprises a set of items (e.g., 809 in manufacturing) whose physical output is tracked monthly. This classification offers insights into how industrial supply conditions evolve due to raw material constraints, policy shifts, or global demand.
- Manufacturing is the largest sector, it includes ~ 809 items, ranging from food and textiles to automobiles and electronic goods.
- Mining includes 29 items, encompassing the extraction of coal, crude oil, natural gas, and other minerals.
- Electricity includes 1 item: Generation from conventional and renewable sources.
Total Items covered: 839
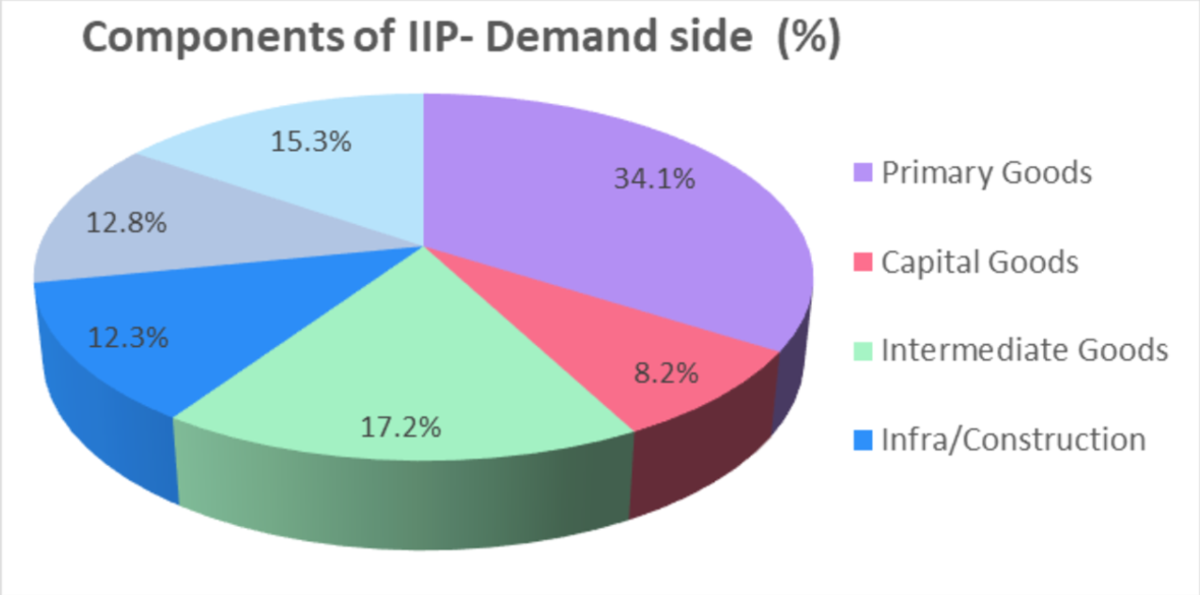
Demand-Side Classification of IIP (Use-Based)
The demand side or use-based classification of IIP reflects the end-use of the goods produced, offering insights into investment and consumption patterns. It includes six categories: Primary Goods, Capital Goods, Intermediate Goods, Infrastructure/Construction Goods, Consumer Durables, and Consumer Non-Durables. This segmentation helps policymakers and analysts assess the underlying drivers of demand, such as private consumption, infrastructure investment, or industrial interlinkages.
Overall, the data is compiled from manufacturing units (both private and public sector), industry associations (such as ASSOCHAM and state electricity boards.
Recommended for you
Readers also explored
How Tax Relief and Rate Cuts Will Shape India’s Economy

India's IT Sector Outlook for FY2026
Calculation of IIP
The IIP is essentially a volume index tracking the production quantities over time relative to a base year (currently 2011–12). It is calculated using the Laspeyres index formula. A brief step-by-step calculation of the index using the formula is given below:
Step 1: Selecting the Base year against which current production is compared. Current base year: 2011–12 = 100
Step 2: Item Selection and Weightage
Each item is assigned a weight based on its contribution to Gross Value Added (GVA) in the base year. Items are selected from three sectors:
- Manufacturing (809 items)
- Mining (29 items)
- Electricity (1 item)
Step 3: Collection of Production Data
Monthly data on physical output is collected from industrial establishments, CPSEs, state electricity boards, and sector associations.
Step 4: Compute Production Ratio, R: For each of the 839 items, calculate the ratio of current month production to base year production:
R = (Current Output) / (Base Year Output)
Step 5: Multiply each ratio by its corresponding item weight to obtain the weighted production ratio.
Step 6: Sum up the weighted values for all items within each sector to obtain the sectoral index.
Step 7:The final IIP is the weighted average of sectoral indices
IIP = ∑(Sectoral Index × Sector Weight)
Why is IIP important?
Being the barometer of industrial activity, IIP holds significant strategic importance for wealth managers and Economists, in the following ways:
- Economic Health Indicator
IIP serves as a high-frequency indicator of industrial activity, offering early signals of economic cycles—recovery, stagnation, or slowdown. It helps assess whether output is expanding or contracting, guiding macro-level decisions. - Monetary & Fiscal Policy Tool
IIP numbers also influence interest rate decisions, liquidity injections, sectoral incentives, and policy announcements. A weak IIP can prompt monetary easing (rate cuts) or new government initiatives for the affected sector. Similarly, a strong growth may justify a tightening stance to prevent overheating. - Sectoral Strategy for Wealth Managers
IIP disaggregates growth by sector (e.g., capital goods, durables), thereby enabling sector rotation strategies in equity portfolios. For instance, a surge in capital goods output may indicate investment recovery, favouring industrial and infrastructure stocks.
IIP can also be viewed as a forward-looking gauge of demand in key sectors. Strong IIP data may increase risk appetite and prompt rotation into cyclical sectors. - Forecasting & Research for Economists
Economists use IIP to forecast GDP, estimate the output gap, and assess the effectiveness of policy tools like PLI or public capex. - Consumption vs Investment Trends
IIP disaggregation helps distinguish between consumption-driven growth (durables, non-durables) and investment-led growth (capital goods), crucial for all stakeholders.
Recent Trends in IIP
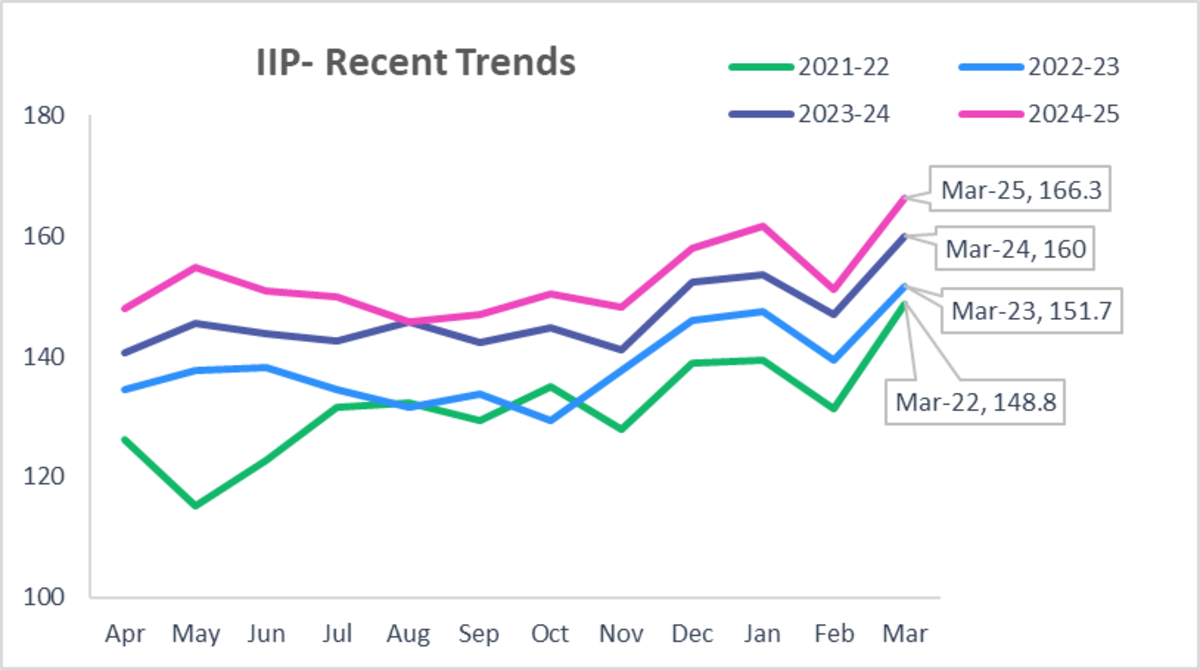
- After showing a strong recovery post-COVID-19 pandemic, IIP consistently showed good growth of ~4–6% YoY through late 2022 and early 2023, underpinned by robust manufacturing and infrastructure spending.
- FY’23 marked a period of broad-based and real recovery. IIP averaged around 5.9% YoY, buoyed by robust manufacturing growth, strong government capital expenditure, PLI (Production-Linked Incentive) schemes and a favourable rural demand environment
- Between Jul–Nov-24, IIP showed steady growth (~4–5%), except Aug-24, where it briefly dipped to marginal contraction (−0.1%) due to base effects and monsoon disruptions.
- But the momentum seems to have faded in early 2025: Feb (2.9%), Mar (3.0%), Apr (2.7%) — with April marking an eight-month low driven by sluggish mining, electricity, and manufacturing and a high base effect.
- In recent months, on the supply side, mining and electricity have slowed significantly, contributing to April’s IIP dip to 2.7%. On the demand side, Primary goods and Consumer non-durables have also contracted or remained weak.
- Capital goods have shown a surge (+20%), signalling potential revival in investment and PLI-led machinery spending. Consumer durables (~ +7%) have grown steadily, showing improved household demand.
Future Outlook
- With multiple RBI rate cuts, including the surprise 50 bps rate cut to 5.50 % in Jun-25, alongside a reduction in CRR by 100 bps, the monetary environment is likely to be a lot more supportive.
- The cheaper availability of credit is likely to boost manufacturing and capital goods production and also stimulate consumer durables and housing demand through lower EMIs.
- As the industrial activity picks up, it is likely to lift electricity and mining output as well.
- Moreover, the tax cuts announced by the government, raising the tax-free threshold to ₹12 lakh and lowering rates, would boost disposable income. This consumption-led stimulus is also likely to boost IIP, especially in consumer durables, autos, FMCG, and associated manufacturing sectors over the near term.
- Thus, looking at the domestic factors, IIP growth appears poised to accelerate over the next few months, potentially reversing the sluggish growth seen in early 2025. However, success hinges on effective credit transmission and sustained global economic stability.
- However, IIP may face headwinds due to evolving global dynamics. A slowdown in global demand could weigh on export-oriented sectors. Rising geopolitical tensions, including trade frictions and sanctions, may disrupt supply chains and impact raw material imports, especially for electronics and EV components. Additionally, oil price volatility stemming from West Asia could raise input costs for industries.
Limitations of the Index of Industrial Production
- Being a volume-based index, IIP does not capture price changes or productivity improvements. As a result, it can misrepresent actual economic value when inflation or deflation distorts real output perception. For example, in the case of shrinkflation, companies reduce the size or quantity of a product while keeping the price unchanged—essentially delivering less value per unit.
- IIP primarily covers the organised sector, leaving large parts of the unorganised and informal economy—especially in manufacturing—underrepresented. Additionally, data lags and frequent revisions (quick estimates, final revisions) can reduce its utility for real-time decision-making.
- IIP relies on a fixed basket of items and base-year weights (currently 2011–12), which can result in obsolescence. Some items lose relevance or are replaced by newer products, leading to distorted industrial insights if the base year is not updated regularly.
- Lastly, the IIP is not seasonally adjusted, which can make month-on-month comparisons misleading.
To summarise, the Index of Industrial Production is a key economic indicator that measures the volume of industrial output in India. It serves as a short-term barometer of industrial activity, helping policymakers, economists, and investors track growth trends, anticipate GDP performance, and guide monetary or fiscal responses. It is useful in identifying sector-specific momentum, such as consumer demand (durables, non-durables) or investment cycles (capital goods).
However, IIP should be interpreted with caution. It captures physical output, not value or quality, and doesn’t reflect practices like shrinkflation or informal sector shifts. It is also prone to data revisions and time lags, making real-time decisions challenging.
To use IIP effectively, it should be combined with other indicators like PMI, core infrastructure output, credit growth, and retail sales. This holistic view helps analysts and decision-makers better assess the economy’s direction and sector-level strengths or weaknesses. In essence, IIP is a valuable signal—best used as part of a broader economic dashboard.