Global Asset Distribution: Real Estate's Dominance and Crypto's Rapid Rise
Most investors assume that equity markets are the largest component of global wealth. But that’s far from true. A breakdown of the world’s total asset base shows something very different. Understanding where global wealth is actually concentrated is the first step to evaluating the portfolio strategy.
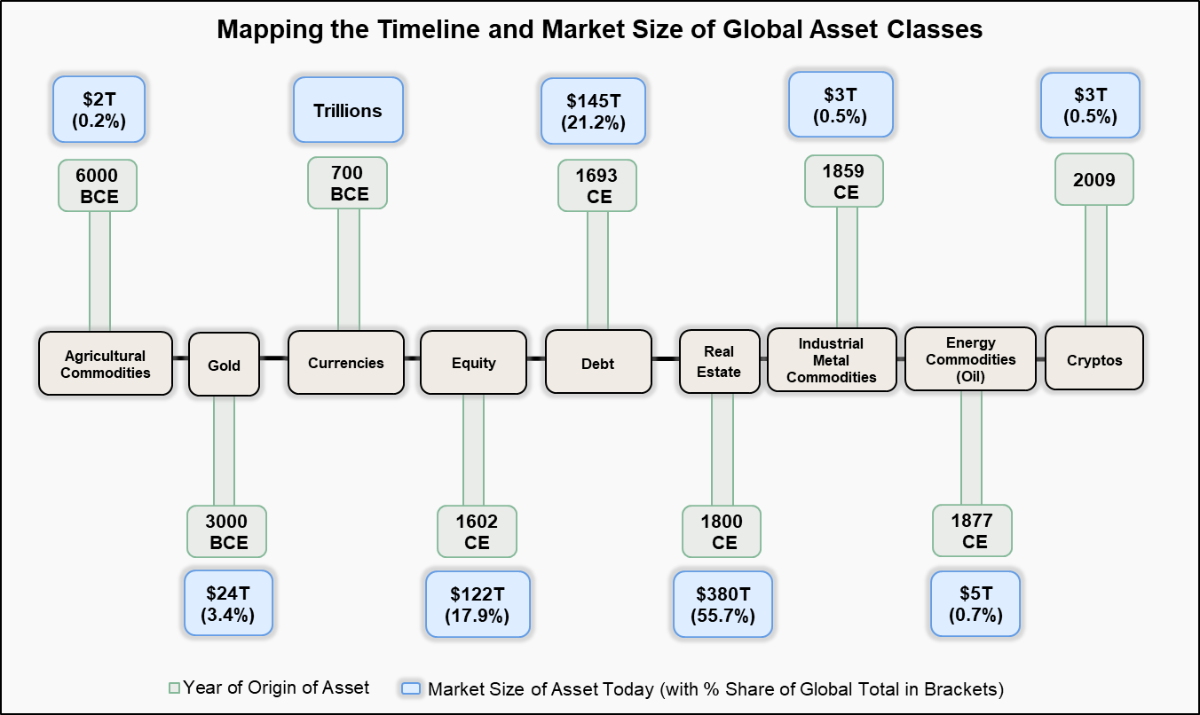
- Real estate remains the world’s largest asset class, though only 1% is investable via REITs.
- Debt ($145T in market size today) began with British “consols,” becoming the bedrock of institutional portfolios.
- Agriculture (~6000 BCE) was humanity’s first asset, made investable in the 1800s via futures.
- Crypto has risen at a breathtaking pace, outpacing nearly every other asset class in recent years. It originated in 2009 but went mainstream post-2017 bitcoin rally. It now commands $3.4T, led by Bitcoin’s 62% share.
- Equities ($122T in market size today) trace back to 1602 with the Dutch East India Company, but went mainstream in the 20th century.
- Gold (~$24T in market size today) has served as a hedge since ~3000 BCE.
Why Diversification Still Wins: 7-Year Drawdowns Tell the Real Story
Back in 1986, a landmark study by Brinson, Hood, and Beebower found that nearly 90% of a portfolio’s long-term return variability comes from asset allocation, not timing the market or picking stocks.
Understanding what drives return volatility is only part of the equation. What matters just as much is understanding risk. That’s where asset allocation becomes even more critical.
To understand risk better, it helps to look at the historical drawdowns of each asset class over different time frames. Drawdowns reveal the real, often overlooked, cost of volatility—both financial and emotional.
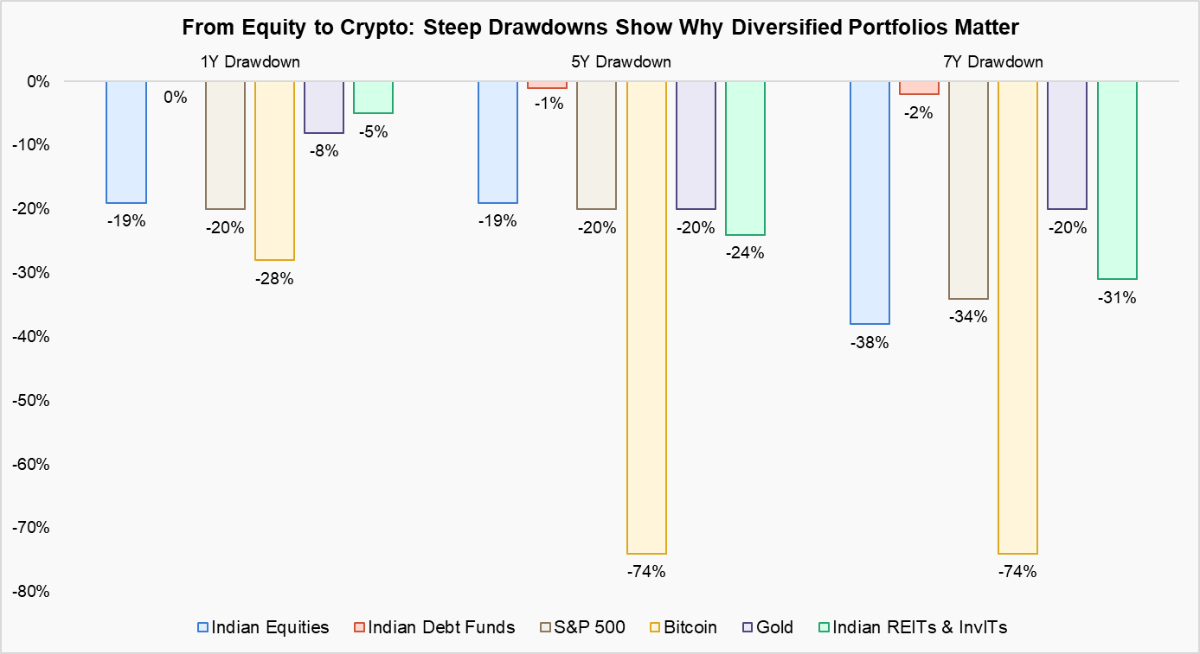
*Note: The above graph illustrates past 1-year, 5-year, and 7-year drawdowns across various asset classes. Drawdowns shown use the following proxies — Nifty 500 (Indian Equities), select Indian Debt Mutual Funds, Nifty REITs & InvITs Index (Indian REITs & InvITs), and XAU/INR (Gold). All asset classes are in INR terms.
Recommended for you
Readers also explored
A Mid-Year Check: Whether India is in Flux
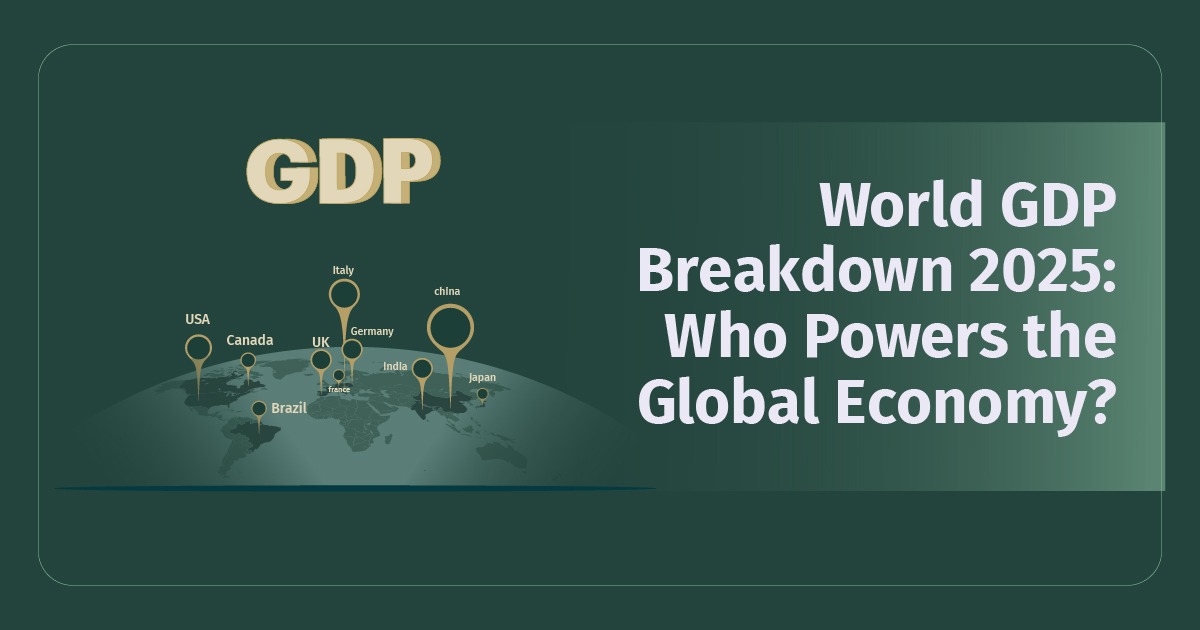
World GDP Breakdown 2025: Who Powers the Global Economy?
What Global Pension Funds Know That Retail Investors Often Forget
Investor behaviour is changing. Many now chase trending assets out of FOMO, often without a solid long-term plan. In contrast, institutional investors like pension funds focus on beating inflation steadily, not market noise. Between 2004 and 2024, their equity exposure fell, alternatives rose, but their discipline stayed.
The takeaway: Diversify wisely, rebalance with intent, and stick to a strategy built to last.
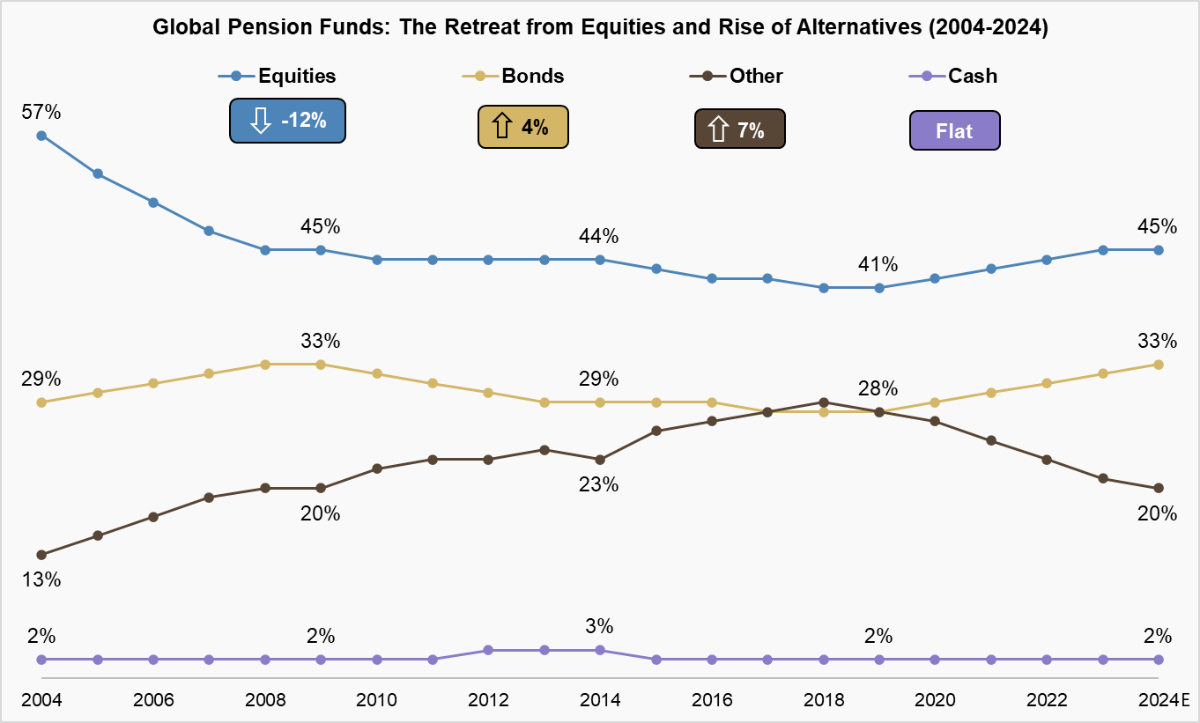
*Note: The above graph shows the asset allocation trends among major pension markets (P7) countries namely, US, UK, Japan & more. Other include private equity, hedge funds, infrastructure, insurance contracts, commodities, REITs, InvITs and more.
Inside the Portfolios of India’s Wealthiest
A closer look at how India’s wealthy invest offers valuable insights. Equities dominate at 39%, followed by debt and real estate at ~20% each, and gold at 10%. UHNIs are allocating more to AIFs, private equity, and startups, while HNIs maintain a stronger preference for real estate. Crypto and NFTs remain niche, with just 2% exposure.
Wealth today is built on diversification, discipline, and adaptability, not just growth.
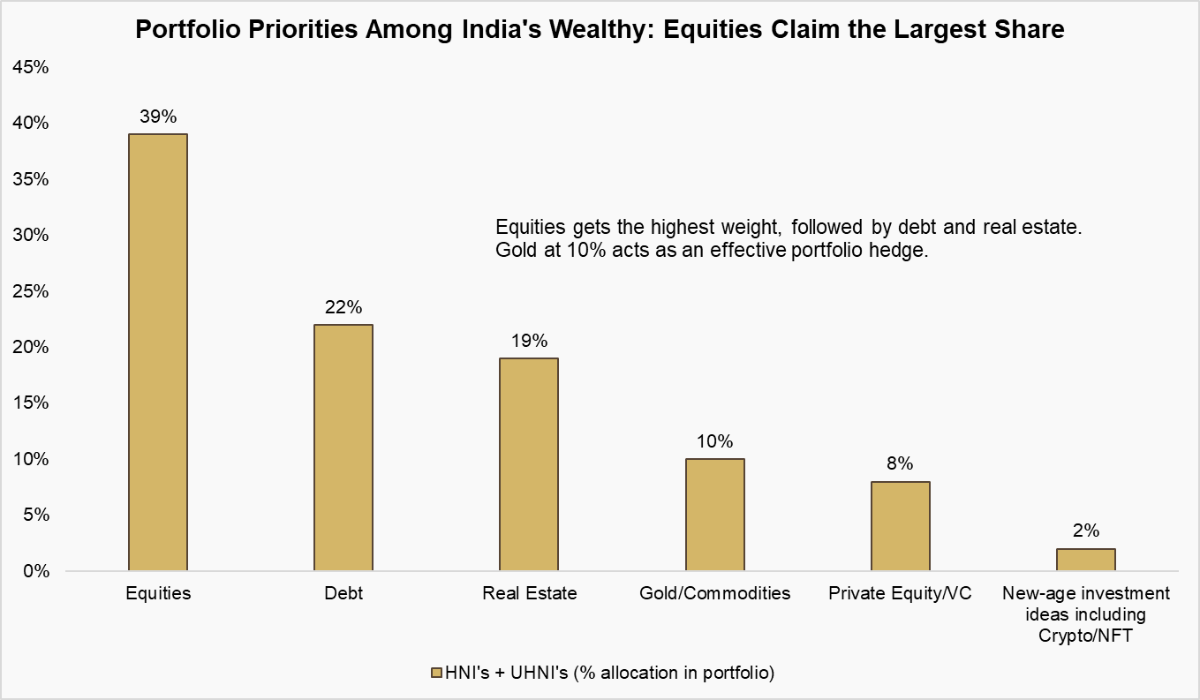
*Note: The above graph presents insights from an extensive survey conducted with as many as 388 UHNIs and HNIs across India. All the individuals surveyed had a net worth of more than ₹50 crore.
Did you know?
India’s wealth landscape is undergoing rapid evolution. Knight Frank’s Wealth Report 2024 projects a 50% surge in the number of ultra-high-net-worth individuals (UHNWIs) between 2023 and 2028, from 13,263 to 19,908, the fastest growth globally.
Investing for Inflation, Growth, Liquidity or Lower Price Risk?
Every investor wants a portfolio that grows steadily, beats inflation, and gives them access to money when needed. But here’s the truth: no single asset class delivers on all three fronts.
The Investment Trade-off Matrix
| Asset Class | Inflation Hedge | Growth Potential | Liquidity | Price Risk | Role in Portfolio |
|---|---|---|---|---|---|
| Equity | High | High | High | High | Core growth engine |
| Debt Funds | Low | Moderate | High | Low | Capital preservation + income buffer |
| Gold | High | Moderate | Moderate for Physical Gold High for Gold ETFs | High | Volatility hedge in stress periods |
| Residential Real Estate | Moderate | Moderate | Low | Medium | Emotional anchor offering stability, shelter & long-term capital appreciation |
| Commercial Real Estate | Moderate | Moderate | Low for Direct Property High for REITs | Medium | Real return generator with income + diversification benefits |
| Crypto | Moderate | High | High | Very High | High-risk, high-reward satellite exposure |
| Private Equity/VC | Moderate | High | Low | Very High | Illiquidity-premium play for long-horizon alpha |
Use Correlation Matrix to Combine Assets with Low/Negative Correlations and Reduce Volatility
Understanding asset correlation is fundamental to modern portfolio theory. By leveraging a Correlation Matrix to assess how different asset classes move with each other (ranging from -1 to +1), investors can identify and exploit both positive and negative correlations. This enables the construction of portfolios that reduce overall volatility through strategic diversification.
| Correlation | Equity | Real Estate | REITs & InvITs | Debt Funds | Gold |
|---|---|---|---|---|---|
| Equity | 1.00 | ||||
| Real Estate | -0.06 | 1.00 | |||
| REITs & InvITs | 0.22 | -0.12 | 1.00 | ||
| Debt Funds | 0.12 | -0.07 | 0.02 | 1.00 | |
| Gold | -0.04 | 0.03 | 0.01 | -0.01 | 1.00 |
*Note: The table shows correlations across Indian asset classes using the following proxies: Nifty 500 (Equity), Nifty REITs & InvITs TRI (REITs & InvITs), 1 Finance TRI (Real Estate), selected debt mutual funds — Aditya Birla SL Liquid Fund, ICICI Pru All Seasons Bond Fund, and ICICI Pru Short Term Fund (Debt), and UTI Gold ETF (Gold).
Conclusion
In a world of constantly evolving risks, whether driven by market volatility, economic shifts, or geopolitical uncertainty, intuition alone isn’t enough. Investors need a well-structured plan. It’s not just about knowing what your portfolio holds, but about ensuring it aligns with your financial goals, the broader macroeconomic landscape, and global capital allocation trends.
Our Asset Allocator Tool helps design an optimal portfolio mix based on age and prevailing macroeconomic conditions.