In our Global Economic Outlook 2026, we argued that diversification within the metals basket was the priority for 2026. That thesis has been stress-tested at a rate no one anticipated. The US-Israel military operation against Iran, which began on February 28, has effectively shut down the Strait of Hormuz, the narrow waterway through which 20% of global oil and roughly 9% of the world’s aluminium supply transits. The disruption is not just an energy story. For metals, the Hormuz closure has exposed a web of supply dependencies that most investors had not priced in.
Metals Outlook
| Metal | Long-Term Outlook | Our View |
| Aluminium | Positive | Structural tightness persists due to China’s 45.5 mtpa cap and energy transition demand; prices are increasingly driven by geopolitical and supply-chain disruptions, making the outlook positive but volatile. |
| Copper | Positive | Long-term demand from electrification, EVs, and AI remains intact; near-term is capped by macro, but constrained mine supply and emerging supply risks reinforce the long-term bullish case. |
| Gold | Neutral | Elevated real yields may cap upside in the near term, but central bank buying and geopolitical fragmentation provide a structural floor. |
| Silver | Neutral | Industrial demand from solar and EVs supports the long-term outlook. However, sensitivity to global growth and monetary conditions implies a more volatile path before the next sustained upcycle. |
Hormuz Is More Than an Oil Chokepoint
The headlines have understandably focused on oil. But the Strait of Hormuz carries far more than crude.
Yes, ~20% of global oil flows through the Strait. But the current disruption reveals a more complex reality: Hormuz is also a critical node in global metals supply chains.
- ~9% of global primary aluminium production is tied to the region
- ~24% of the global sulphur trade passes through the Strait
- ~8-10 million tonnes of alumina (used in aluminium production) flows through the same route
With major shipping lines suspending transit in early March, this flow has been severely disrupted, creating immediate logistical bottlenecks and forcing markets to reprice risk.
This is not just about supply loss but about supply being temporarily stranded.
Aluminium Is The Direct Casualty of Hormuz
Aluminium is the metal most directly exposed to the Iran conflict. Since February 28, LME aluminium prices have risen by roughly 11%, reaching a peak of $3,520/tonne on March 13th, making it the best-performing industrial metal in this period. Prices have since pulled back to around $3,251 as of March 23, still elevated but reflecting some market expectation that the Strait may partially reopen.
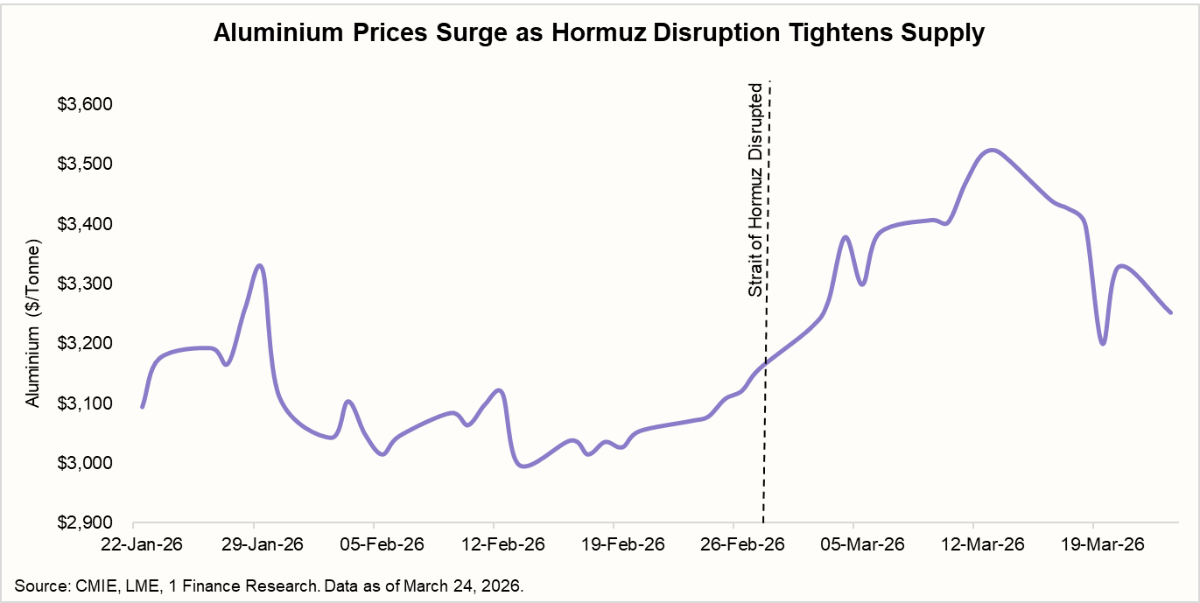
What makes this move significant is that the disruption is not driven by demand or even production, but by logistics.
Gulf smelters are still capable of producing aluminium, but they are unable to ship it efficiently due to disruptions in the Strait of Hormuz. At the same time, they rely heavily on imported alumina, the key raw material required for production. The Middle East imports nearly 13 million tonnes of alumina annually, most of which passes through the Strait.
This creates a time-sensitive risk. If the disruption continues beyond existing inventory buffers, estimated at three to four weeks, smelters may be forced to cut output. This could lead to a potential loss of 1.0–1.25 million tonnes of global aluminium supply.
| Middle East Aluminium Supply Under Stress | |||
| Smelter (Country) | Annual Aluminium Production (MT) | Status (as of March 2026) | Key Vulnerability |
| Qatalum (Qatar) | 0.68 million | Controlled shutdown | Gas supply halted by QatarEnergy; reliance on Gulf-linked gas infrastructure |
| Alba (Bahrain) | 1.60 million | 19% capacity cut; force majeure | Strait of Hormuz-linked export routes; shipping delays and insurance-cost spikes |
| EGA (UAE) | 2.70 million | Export disruptions | Imported alumina and semi-finished products routed via the Strait of Hormuz |
| Iranian smelters (Iran) | ~0.60 million | Up to 80% capacity at risk | Direct- or indirect-infrastructure damage; alumina-import-chain disruptions |
| Ma’aden (Saudi Arabia) | 0.78 million | Relatively stable | Partially insulated via the domestic bauxite-to-alumina chain, but still exposed to Gulf-energy-price shocks |
Note: MT refers to million tonnes.
The key swing factor now is China. As the world’s largest aluminium producer, China has idle capacity that can be brought online if prices rise too sharply. However, a production cap of 45.5 mtpa, driven by environmental constraints, limits how much supply can be added.
Aluminium remains the strongest near-term opportunity within metals, supported by a clear supply shock. However, the upside is not unlimited. Any easing of tensions or a policy response from China could quickly stabilise prices.
Copper Caught Between Structural Bull and Cyclical Bear
Copper tells a more nuanced story. Unlike aluminium, copper has actually given up its 2026 gains, with the metal wiping out all year-to-date performance as the worsening conflict pushes energy prices higher and raises recession fears. LME copper is trading around $12,000–$13,000/tonne, down from late-January highs of $13,800.
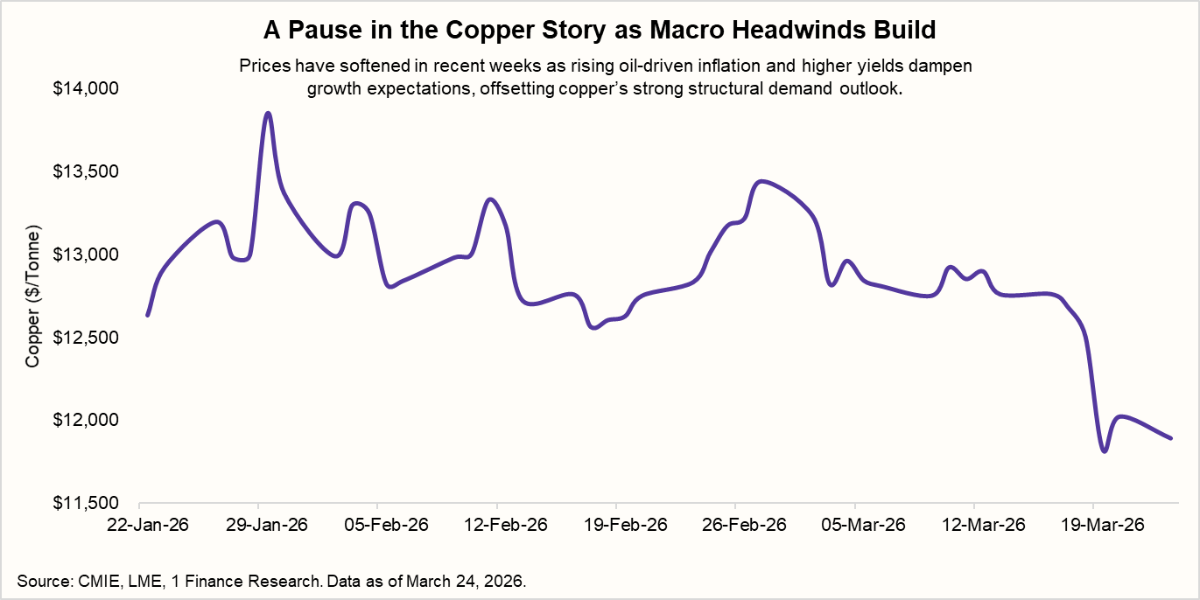
The reason lies in conflicting forces. On one hand, the long-term outlook remains strong. Energy insecurity and rising geopolitical tensions are accelerating the shift toward electrification and renewable infrastructure, both of which are highly copper-intensive. AI data centres alone are expected to consume 475,000 tonnes of copper in 2026, up 110,000 tonnes year-on-year.
On the other hand, the near-term macro environment is turning negative. Higher oil prices are feeding into inflation, pushing bond yields higher and reducing expectations of rate cuts. This weakens growth sentiment and weighs on cyclical metals like copper.
There is also an additional, less visible risk.
The Middle East supplies 45% of global sulphur, a key input for sulphuric acid used in copper extraction, and 24% of that supply passes through the Strait. If the disruption in the Strait of Hormuz continues beyond a few weeks, acid shortages could begin to impact copper production, particularly in regions like Africa and Latin America.
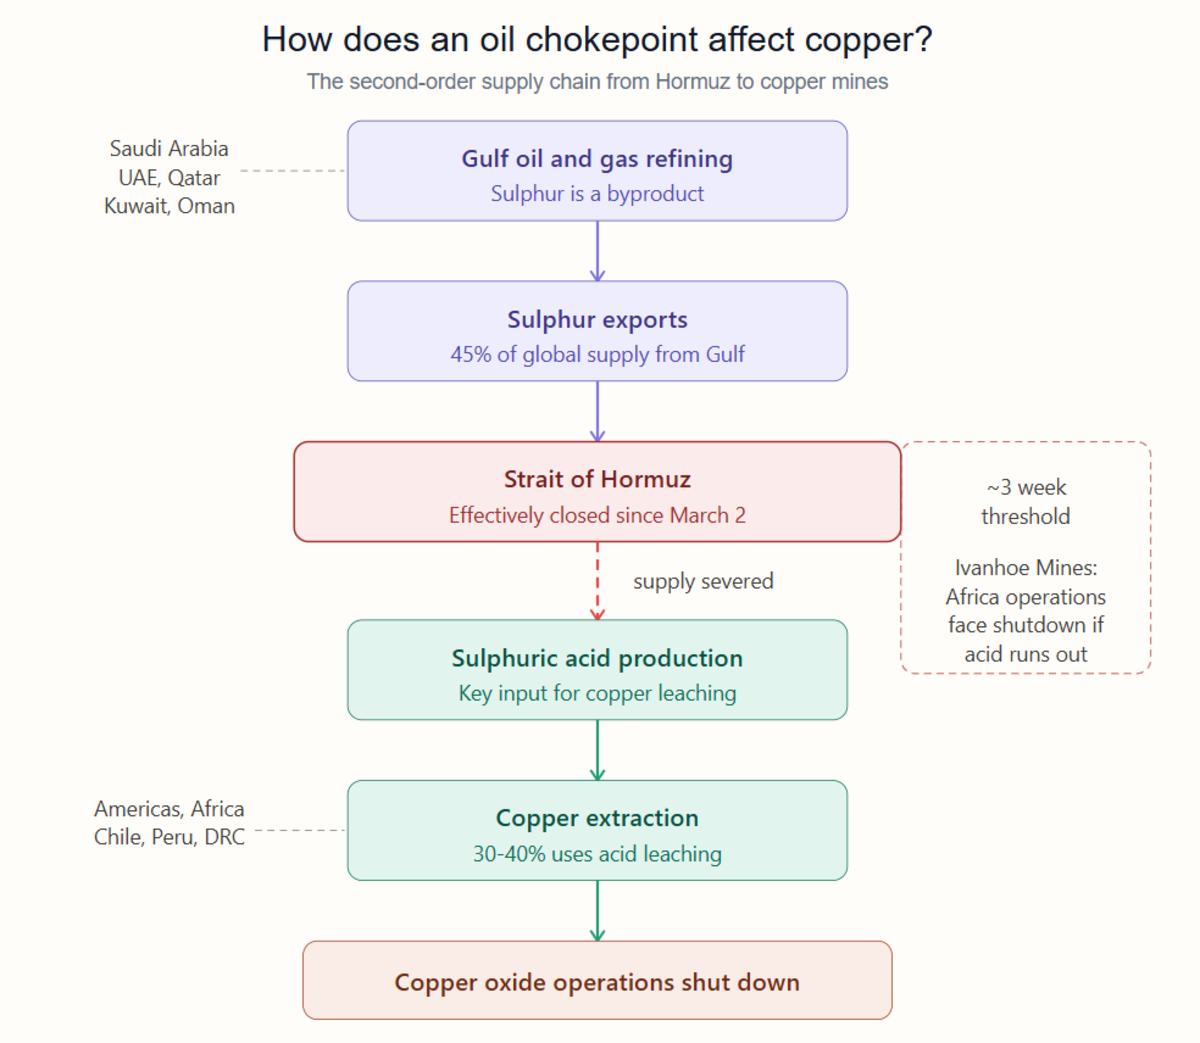
Copper remains one of the strongest long-term opportunities within commodities, but the near-term setup is constrained by macro headwinds. Any prolonged disruption through the sulphur channel could shift this balance quickly in favour of supply-driven upside.
Gold’s Structural Bull Case Is Still Intact
Gold’s reaction to the Iran conflict has been counterintuitive. Prices spiked from $5,222 to $5,313/oz immediately after the February 28 strikes, then fell more than 6% to $5,033 by March 3. As of March 24th, gold is trading around $4,466/oz, well below its all-time high of $5,595 hit in late January.
The explanation is straightforward. Acute geopolitical stress initially benefits the world's primary reserve currency, but in the long run inflation concerns support precious metals. Oil above $100/bbl feeds inflation expectations. Inflation expectations push central banks to stay hawkish. A stronger dollar and rising US real yields make holding gold more expensive. Safe-haven demand exists, but it is being overwhelmed by the rate repricing.
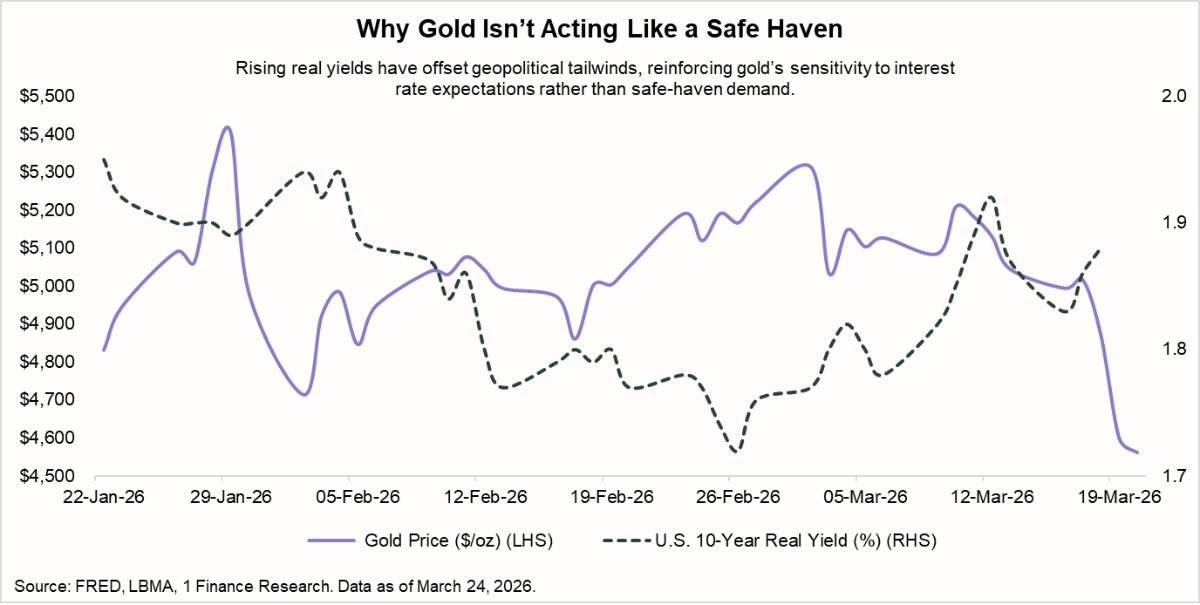
The structural bull case, however, remains intact. Central bank buying, projected at 755 tonnes in 2026, continues to provide a floor. Our view: gold is in a consolidation phase after an extraordinary 63%+ rally in 2025.
Silver Caught Between Industry & Geopolitics
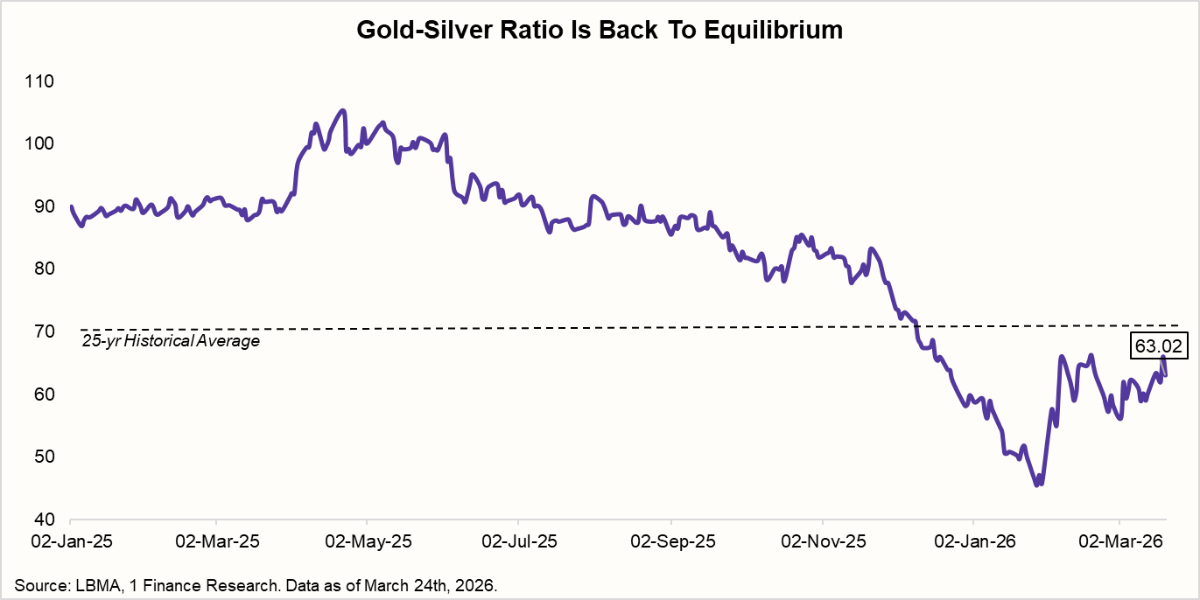
After nearly doubling in 2025 and touching highs of $118/oz in early 2026, silver prices have corrected significantly. Hawkish signals from the Fed and ECB in March further triggered a decline, bringing silver down to the $69-72/oz range.
The gold-to-silver ratio is now around 63, close to its long-term average of 70, suggesting that relative valuations have normalised.
Silver’s behaviour reflects its dual role. It is both a monetary metal and an industrial input. On one hand, tighter financial conditions have weighed on prices. On the other hand, strong demand from solar, electronics, and EVs continues to provide structural support.
India has been a particularly active buyer, with investors substituting silver for gold as gold prices become prohibitively expensive. The recent correction has reset valuations rather than weakened the underlying story. Silver remains well supported by industrial demand and supply deficits.
Conclusion
The Iran‑driven closure of the Strait of Hormuz has done more than spike oil prices; it has exposed a new fault line in global metals markets. Aluminium, the most energy‑ and logistics‑intensive of the major industrial metals, has become increasingly sensitive to geopolitical disruptions, with the Gulf supply chain playing a central role.
Copper, by contrast, is caught in the middle: its long‑term structural bull case, anchored in electrification, AI, and EVs, remains intact, but the macro‑cycle is turning against it as higher oil‑linked inflation feeds into rate‑path repricing and recession worries. If the sulphur‑supply channel via the Strait of Hormuz is disrupted for more than a few weeks, copper’s narrative could tilt toward supply‑driven upside; until then, investors are effectively being paid to tolerate volatility rather than outright upside.
Gold and silver complete the picture. Gold’s consolidation after a 60%+ rally in 2025 reflects the battle between safe‑haven demand and hawkish real‑rate pressure, leaving it in a “structural floor, near‑term overhang” regime. Silver, meanwhile, is being pulled in opposite directions: a sixth‑year supply deficit, rising industrial demand from solar and EVs, and strong Indian and Western investment flows on one side, and pronounced sensitivity to growth and rate‑shock narratives on the other.
For investors, the implication is clear: diversification within metals is no longer a nice‑to‑have; it is the stabiliser.
- Tactically, aluminium offers the clearest near‑term upside, tied to the duration of the Hormuz‑related logistics shock.
- Strategically, copper and silver offer the strongest exposure to the energy‑transition and AI‑capex cycles, but they require discipline around macro and rate‑risk.
- Defensively, gold anchors portfolios against the very geopolitical and inflation shocks that are currently redrawing the metals map.
The Strait of Hormuz has exposed a deeper truth about global markets—commodities do not move in isolation. They are part of tightly linked systems, where energy, logistics, and industrial inputs interact in ways that are often overlooked until stress reveals them.


