Three things defined the Indian macro picture this month, and they are best read side by side rather than woven into a single story. Foreign investors kept selling equities while the domestic saver held the market up. The RBI's Financial Stability Report put fresh numbers on a slow shift in the shape of household debt. And inflation crossed the 4% mark for the first time in more than a year. Underneath all three sits the same quiet question, which is who is actually providing the capital that keeps this economy moving? We take each in turn, and close with what they mean for advisor conversations.
| Key Takeaways: |
|---|
|
|
|
|
|
Foreign Money Left Equities, the Domestic Saver Replaced It
Between March and June, foreign investors sold ₹2.6 trillion of Indian equities, one of the largest sustained exits the market has seen. Yet the index rose over the same window. The explanation sits on the other side of the trade. Domestic money absorbed the whole of it.
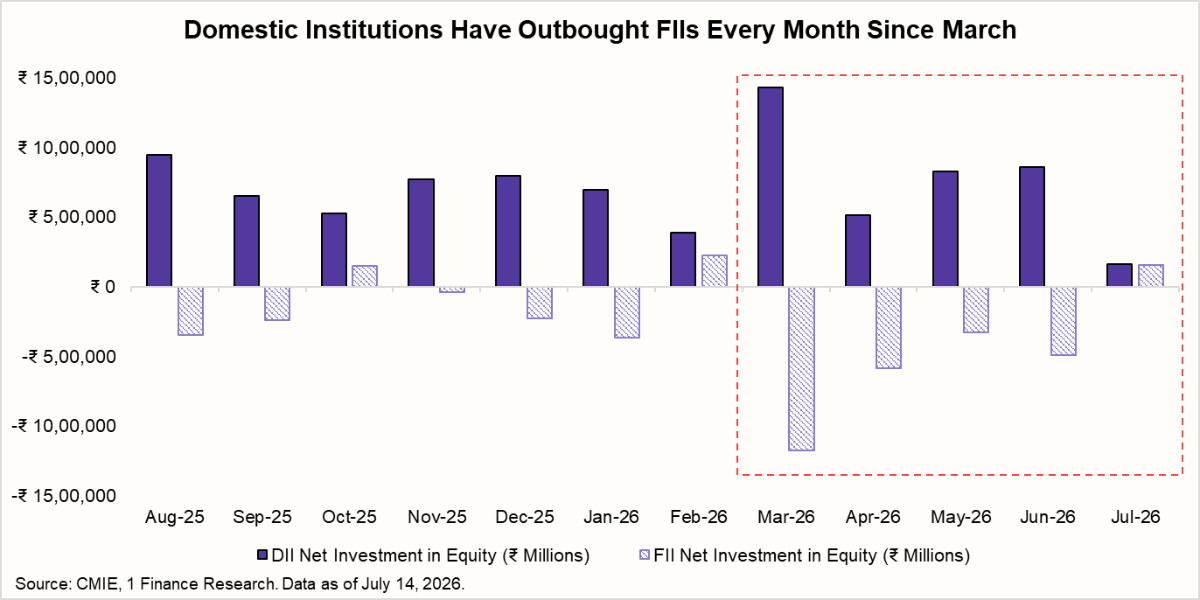
In June, foreign investors sold roughly $5 billion of Indian equities while domestic institutions bought around $8.5 billion. That domestic money is not led by pension funds or insurers. It is overwhelmingly retail, arriving through systematic investment plans. SIP contributions reached ₹31,781 crore in June, and net inflows into equity mutual funds were ₹28,973 crore.
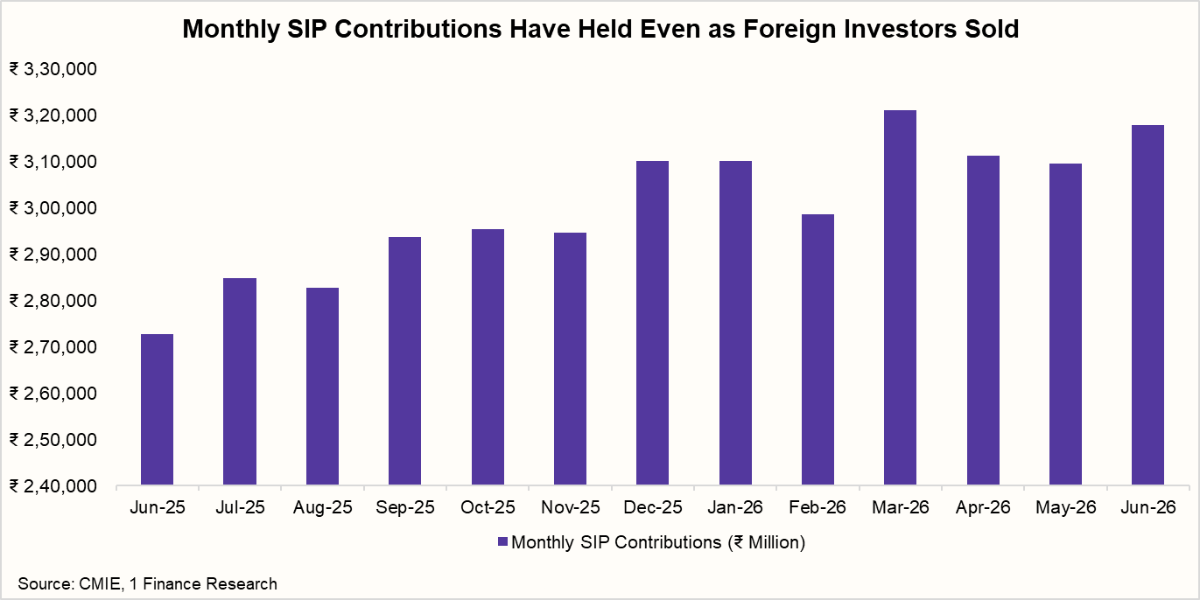
This is a structural change worth naming plainly. For two decades, the foreign institutional investor set the marginal price of Indian equities, and the market moved closely with foreign flows. That link has weakened. Through four straight months of foreign selling, the domestic bid did not merely cushion the fall; it absorbed the exit in full. It is the payoff of a decade of financialisation, of the SIP habit spreading from the metros into smaller towns, with mutual fund folios growing from 4.2 crore in FY2015 to 27.4 crore in FY2026.
Foreign Money Did Not Leave India, It Moved Into Debt
The equity exit was only half of what foreign investors did. Through the same four months, they were buying Indian debt heavily. They put ₹52,272 crore into debt in June alone, including a record ₹39,640 crore into government securities, above the previous monthly high of ₹22,005 crore from August 2024.
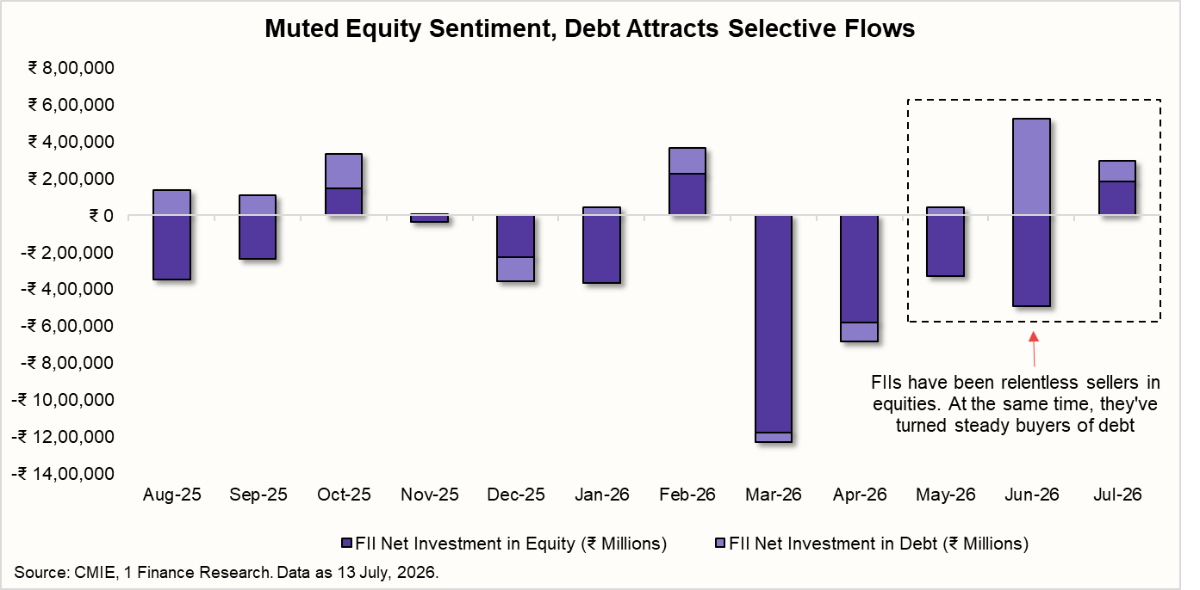
This was policy working as intended. On June 5, the government exempted foreign investors from tax on interest income and capital gains on government bonds, and the RBI expanded the Fully Accessible Route to all new long-dated issuance. A long Indian government paper, previously awkward for foreign pension and insurance money to hold, became clean overnight. The 10-year yield has since eased to a four-month low near 6.74%, and index inclusion hopes add to the pull, since Bloomberg's earlier objection on taxation has now been addressed.
The same June 5 package included a window aimed at NRI money, the FCNR(B) swap facility, and it is worth a closer look because expectations for it ran well ahead of reality. The RBI absorbed the currency hedging cost and lifted the rate ceilings soon after, and banks raised dollar deposit rates from around 3.5% to as much as 7.1%. Brokerages expected the window to pull in $40 billion to $60 billion. One month in, it has drawn $9 to $10 billion.
| Why the 2013 Playbook Does Not Repeat | ||
|---|---|---|
| 2013 window | 2026 window | |
| US alternative rate | ~0.25% | ~4.5% |
| Headline FCNR rate | ~5.5% | ~6.0%-7.1% |
| Spread available | ~525 bps | ~250 bps |
| Leveraged trade viable | Yes | No |
| Raised | ~$26 billion | $9 to $10 billion so far |
| Expectation | - | $40 to $60 billion |
The shortfall is a matter of arithmetic rather than sentiment. Everyone is anchoring to 2013, when a near-identical window raised around $26 billion, but the two are not comparable. In 2013, US deposits paid close to 0.25% against an FCNR rate near 5.5%, a spread of over 500 basis points, and NRIs could borrow cheaply in dollars to fund the trade. Today, US deposits already pay about 4.5%, so a 7% Indian rate is a spread of roughly 250 basis points, and the leveraged version of the trade does not clear at current US borrowing costs.
The window is worth watching until it closes on September 30, but so far the debt bid, not the NRI deposit, is where the foreign appetite for India is genuinely showing up.
The Domestic Money Is Concentrated in Small Caps, Which Are Now Expensive
Where the domestic money went matters as much as its scale, and here the picture is uneven. The flows tilted hard toward the smaller end of the market. In June, mid-cap funds took in ₹6,090 crore and small-cap funds ₹5,602 crore, against just ₹2,067 crore into large-cap funds, close to six rupees into mid and small caps for every one into large caps.
| Monthly Flow Trend of Equity & Debt Oriented Schemes (₹ Crore) | |||||||
|---|---|---|---|---|---|---|---|
| Category | Jun-26 | May-26 | Apr-26 | Mar-26 | Feb-26 | Jan-26 | Dec-25 |
| Debt-Oriented Schemes (Total) | -1,09,054 | -96,949 | 2,47,490 | -2,94,987 | 42,106 | 74,827 | -1,32,410 |
| Equity-Oriented Schemes (Total) | 28,973 | 22,908 | 38,440 | 40,450 | 25,978 | 24,029 | 28,054 |
| Mid-cap funds | 6,090 | 4,385 | 6,551 | 6,064 | 4,003 | 3,185 | 4,176 |
| Large-cap funds | 2,067 | 1,593 | 2,525 | 2,998 | 2,112 | 2,005 | 1,567 |
| Small-cap funds | 5,602 | 4,946 | 6,886 | 6,264 | 3,881 | 2,942 | 3,824 |
The valuation risk, though, is not spread evenly across those funds. Mid-caps and large-caps are not stretched. The Nifty Midcap 150 trades around 29 to 30 times earnings, a touch below its ten-year median of 32.5, and the Nifty 50 sits near 21, in line with its own long-run history. The outlier is small-caps. The Nifty Smallcap 250 has pushed up to roughly 36 times earnings, above its ten-year median of 31, and it has separated from the other two segments over just the last few weeks.
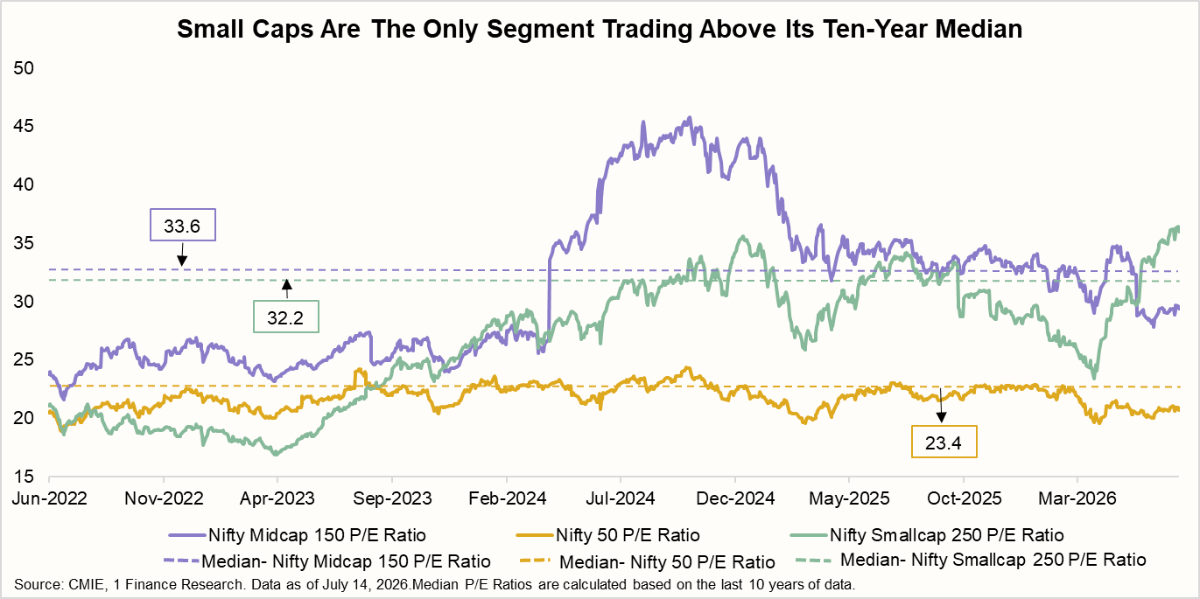
So this is not a blanket warning on small and mid-caps together. Only the small-cap leg is expensive, and that is the part where fresh money is now paying a premium to history. It is also worth remembering that this segment is the one most dependent on the domestic retail bid, since foreign money, when it returns, heads for large caps first.
Household Debt Is Rising, and Its Shape Is Changing
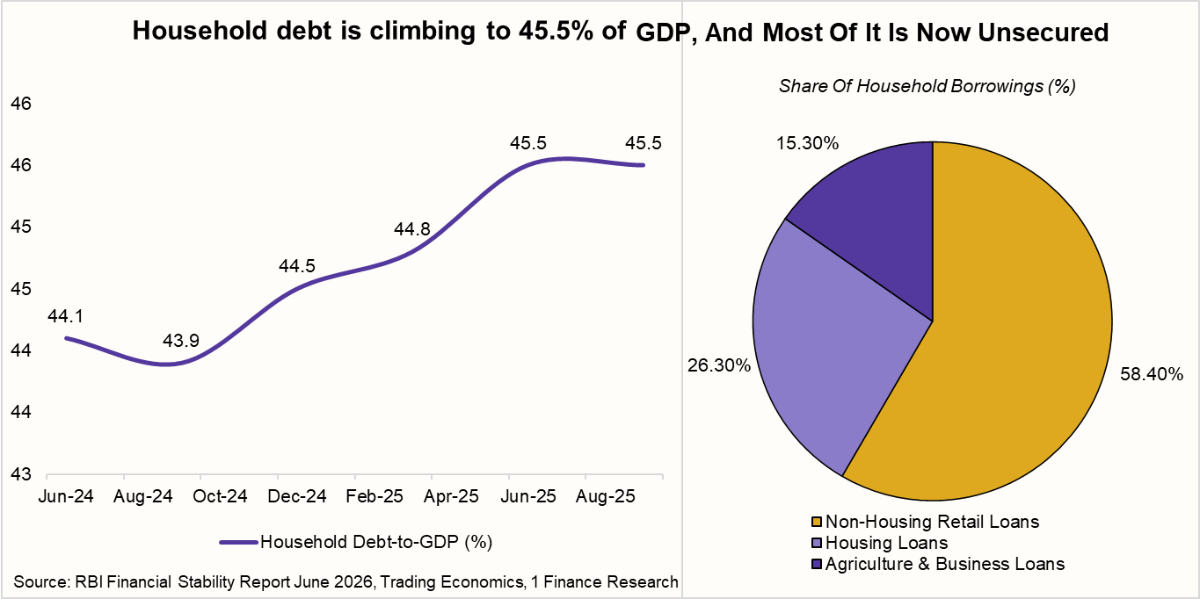
Separately, and on the other side of the household balance sheet, the RBI's Financial Stability Report released on June 30 put a data-backed marker on household borrowing. Household debt stood at 45.5% of GDP as of September 2025, up from 41.3% a year earlier. By global standards, this is still moderate, comfortably below Thailand at 87.3%, Malaysia at 69.9% and China at 59.0%, so the level is not the concern. The composition is.
Non-housing retail loans, meaning personal loans, credit card balances and consumer durable EMIs, now make up 58.4% of all household borrowing, and consumption purposes account for close to half of total household debt. This is the fastest-growing slice, and it differs from a home loan in a way that matters. A housing loan is secured against a house and tends to track long-term income. These newer loans are secured against nothing but the borrower's continuing salary, with no asset behind them if that income falters.
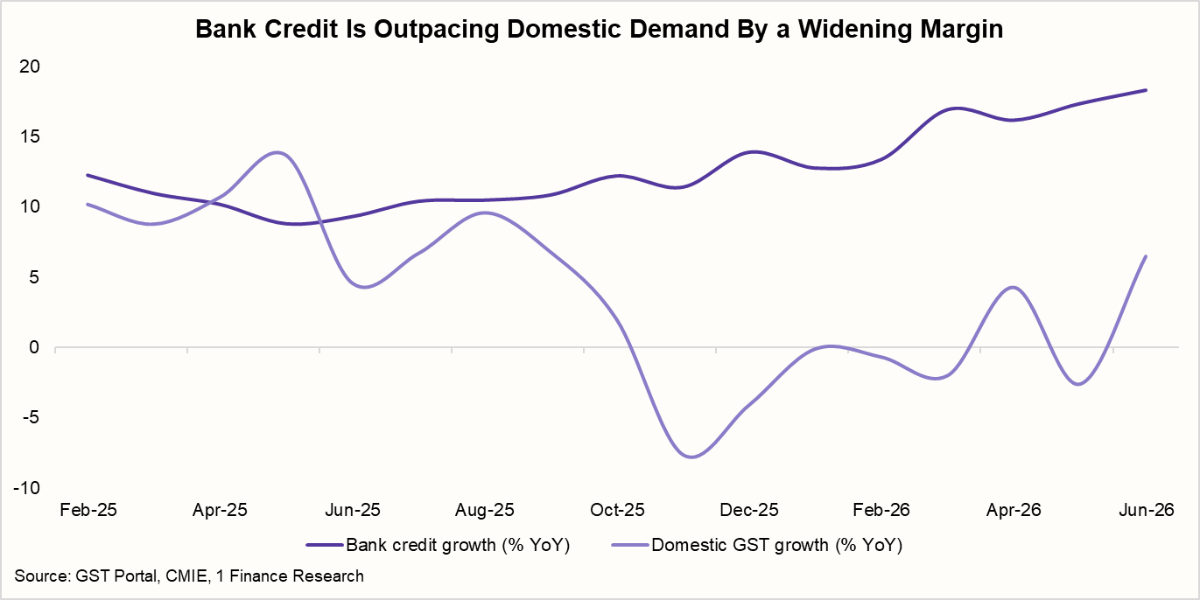
The macro backdrop underlines the shift. Bank credit is growing at 18.6% year on year, a two-year high, while domestic GST collections, the cleanest available proxy for domestic demand, grew just 6.5% in June. When credit outruns the demand, it is meant to reflect by that margin the difference is usually leverage. The FSR names rising household debt, along with a structural shift of savers out of low-cost deposits, as vulnerabilities worth tracking. It also confirms the banking system itself is strong, with gross bad loans at a multi-decadal low of 1.8% and capital at record highs, and retail asset quality still sound at 0.7% bad loans on secured retail and 1.7% on unsecured. The caution is about the household, not the bank.
Inflation Crossed 4% for the First Time in 16 Months
June CPI came in at 4.38%, breaching the RBI's 4% target for the first time in 16 months and marking the sixth consecutive monthly rise. Food inflation ran at 5.32%, transport jumped 256 basis points after the mid-May fuel revision fed through, and rural inflation at 4.74% is running ahead of urban at 3.92%.
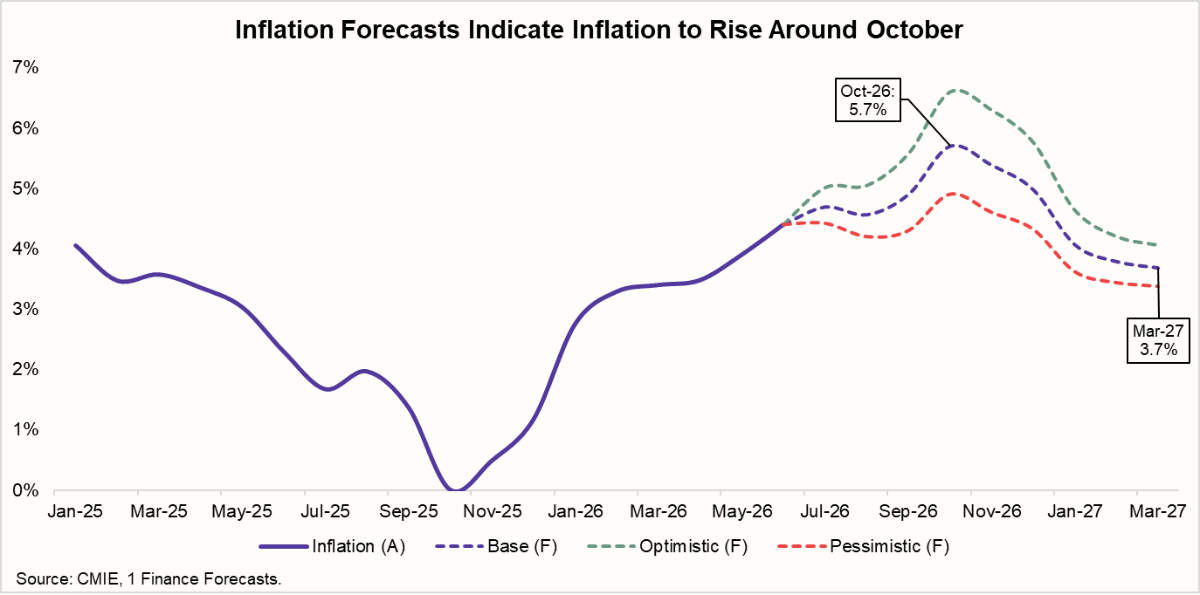
The policy is straightforward. The MPC held at 5.25% on June 5 with a neutral stance, trimmed its FY27 growth forecast to 6.6% and raised its FY27 inflation forecast to 5.1%. The easing cycle is over. SBI Research, Crisil and ICRA now all see FY27 inflation landing between 5.0% and 5.2%.
| The Rate Path From Here | ||
|---|---|---|
| Scenario | Likelihood | Rationale |
| Cut | Very low | CPI has crossed the midpoint, and the RBI's own FY27 forecast is 5.1%. |
| Pause | High | Neutral stance, improving monsoon, steadier rupee. This is now the consensus. |
| Hike in H2 FY27 | Medium (rising) | A failed monsoon, feeding food inflation through H2, is the trigger. Watch October rather than August. |
Two things eased over the month. The monsoon deficit narrowed to 24% by early July from 43% a week earlier, and the rupee recovered from its record low of 96.84 to around 95.60. Neither is settled, and Brent back above $79 after fresh trouble at the Strait of Hormuz is the variable that could unwind both.
What This Means for Advisors
These are separate observations, and the takeaways stand on their own rather than pointing to a single call.
| Theme | Key insight |
|---|---|
| Equity flows | The domestic saver, not the foreigner, now sets the marginal bid. This is a genuine source of stability, but it is a retail bid funded monthly, worth understanding as a different kind of support than institutional flow. |
| Small-cap valuations | Small caps trade well above their ten-year median while mid and large caps do not, and retail flows keep concentrating there. The point is to size the position with that premium in view, not to exit. |
| Household leverage | 58.4% of household debt is now unsecured, and debt is rising while savings are thinning. For clients whose own borrowing mirrors this, it is a natural moment to separate debt that builds an asset from debt that funds consumption. |
| Rates and duration | The 10-year at 6.74% has priced in much of the foreign bid, and the next policy move is more likely a hike than a cut. We would not extend the duration ahead of the August meeting. Accrual at the shorter end gives up little. |
| Currency | The rupee has recovered on the capital account package rather than on fundamentals. The FCNR window closes on September 30, and cumulative inflows by then tell us whether the package worked or merely bought a good quarter. |