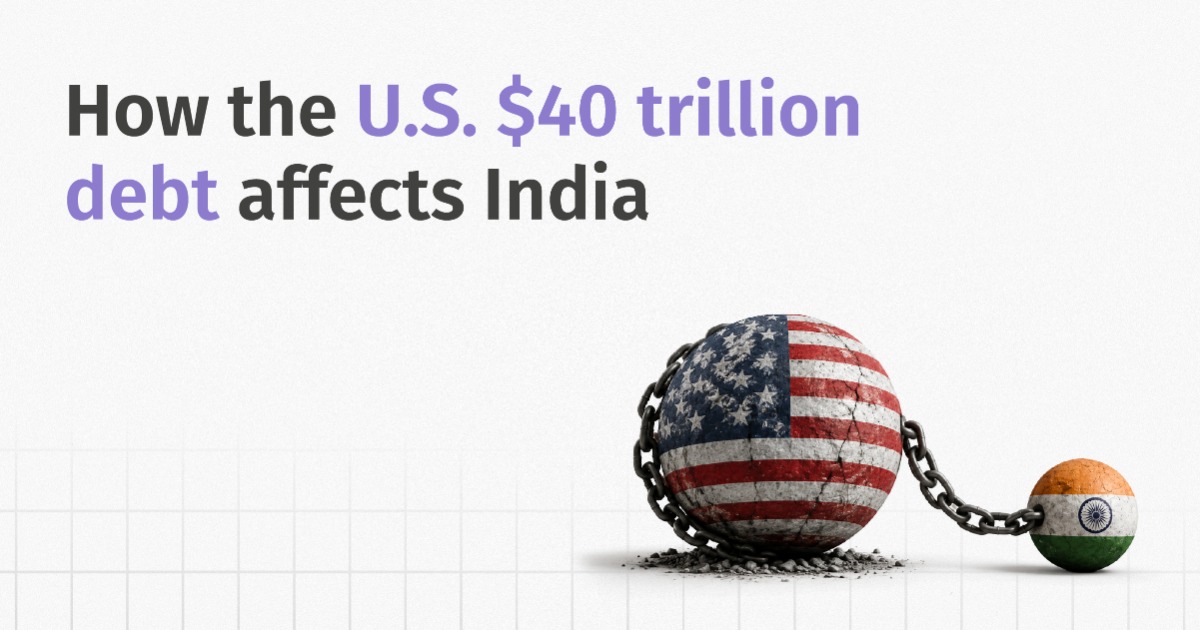
US total public debt outstanding reached $40.05 trillion on August 18, 2026, crossing the $40 trillion mark before the end of fiscal year 2026, which concludes on September 30. The Congressional Budget Office had projected in February that total federal debt would reach $39.4 trillion by the end of FY2026. Of the $40.05 trillion outstanding, $32.27 trillion was debt held by the public, while $7.78 trillion consisted of intragovernmental holdings
The number itself is not the real story. The US has crossed debt milestones every few years for decades, and $40 trillion was always going to arrive eventually. The real question is whether demand for US government debt can keep pace with the supply the Treasury needs to sell, at yields the world can live with. This piece traces that financing question from the US Treasury market through five specific channels into India's rupee, bonds and banking system.
What Actually Crossed the Line
The Treasury's $40.05 trillion figure is total public debt outstanding, sometimes called gross federal debt. It has two parts, and the distinction matters for anyone trying to gauge how much of this debt actually competes with private borrowers for capital.
| What Makes Up the US $40 Trillion Debt | ||
|---|---|---|
| Debt Component | Amount | Why It Matters |
| Debt Held by the Public | $32.28 trillion (80.63%) | The market-facing portion of US debt. It must be absorbed through the Treasury market and is most relevant for yields, auction demand and global financial conditions. |
| Intragovernmental Holdings | $7.75 trillion (19.37%) | Part of total federal obligations, but it does not compete for private or foreign investor demand in Treasury auctions. |
| Total Public Debt Outstanding | $40.03 trillion (100%) | The headline $40 trillion figure most coverage refers to. |
| 💡 US total public debt outstanding stood at $19.94 trillion at the end of January 2017. By August 18, 2026, it had risen to $40.05 trillion, adding more than $20 trillion and growing roughly 101% in under a decade. |
Why July 2026 Was a Warning Sign for the US Fiscal Deficit
Milestones like $40 trillion attract attention, but the pace of new borrowing shows how quickly the fiscal gap is widening. Treasury's Monthly Treasury Statement for July 2026 recorded a monthly deficit of $432.3 billion, with receipts of $334.0 billion against outlays of $766.3 billion. Outlays were $137 billion, or 22%, higher than in July 2025.
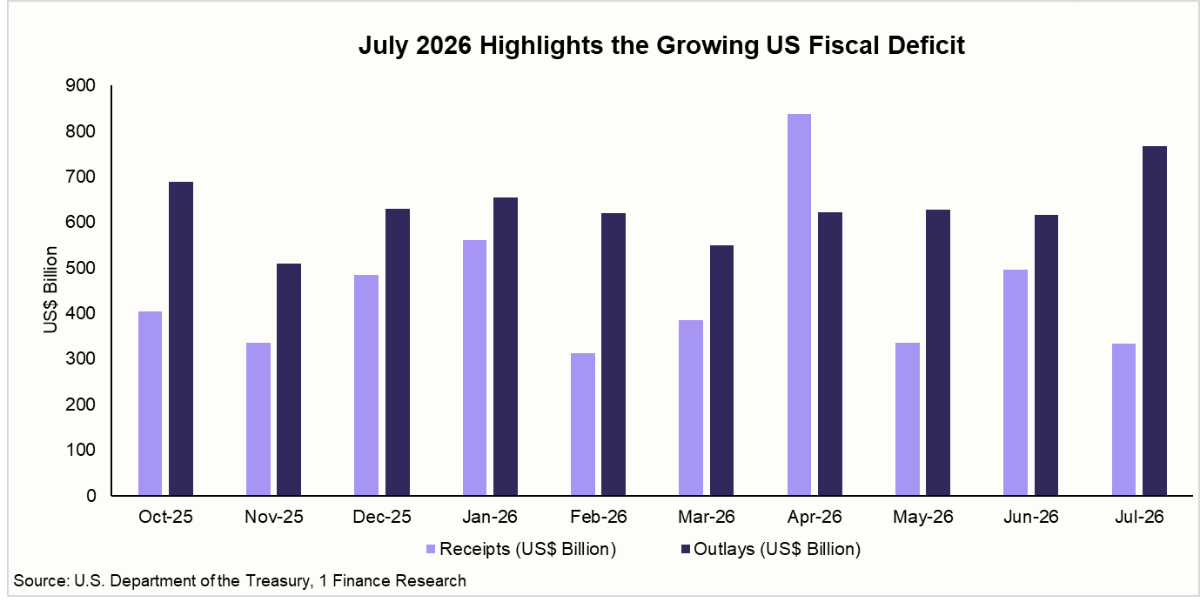
Government receipts, or money collected through taxes and other sources, followed a seasonal pattern during FY2026. April 2026 was the exception, when receipts jumped to roughly $835 billion because of individual and corporate estimated tax payments. This briefly brought the monthly deficit close to zero.
However, this improvement was temporary. In the other months, receipts ranged between $310 billion and $560 billion. Meanwhile, outlays, or total government spending, remained consistently high, barely falling below $510 billion in any month and reaching $766.3 billion in July.
The gap between what the government collected and what it spent widened again immediately after April. By July 2026, the monthly deficit had reached $432.3 billion. This was not simply a one-month spike, but the clearest sign of a pattern that had been building over the previous nine months, with government spending consistently remaining higher than receipts.
Recommended for you
Readers also explored
How US Federal Reserve Monetary Policy Impacts India
 7 min read

India's IT Sector Outlook for FY2026
8 min read
The cumulative FY2026 deficit reached $1,799 billion over the first ten months of the fiscal year, against $1,629 billion over the same period of FY2025, an increase of roughly 10%. With two months remaining, FY2026 had already exceeded the full $1,775 billion FY2025 deficit.
Who Is Still Buying America's Debt
A rising deficit only becomes a market problem if the buyers do not show up. The more useful question than the size of the debt is who is holding it, and whether the composition of that group is stable or shifting. The monthly pattern behind each move, not just the start and end points, is what actually tells buyers apart.
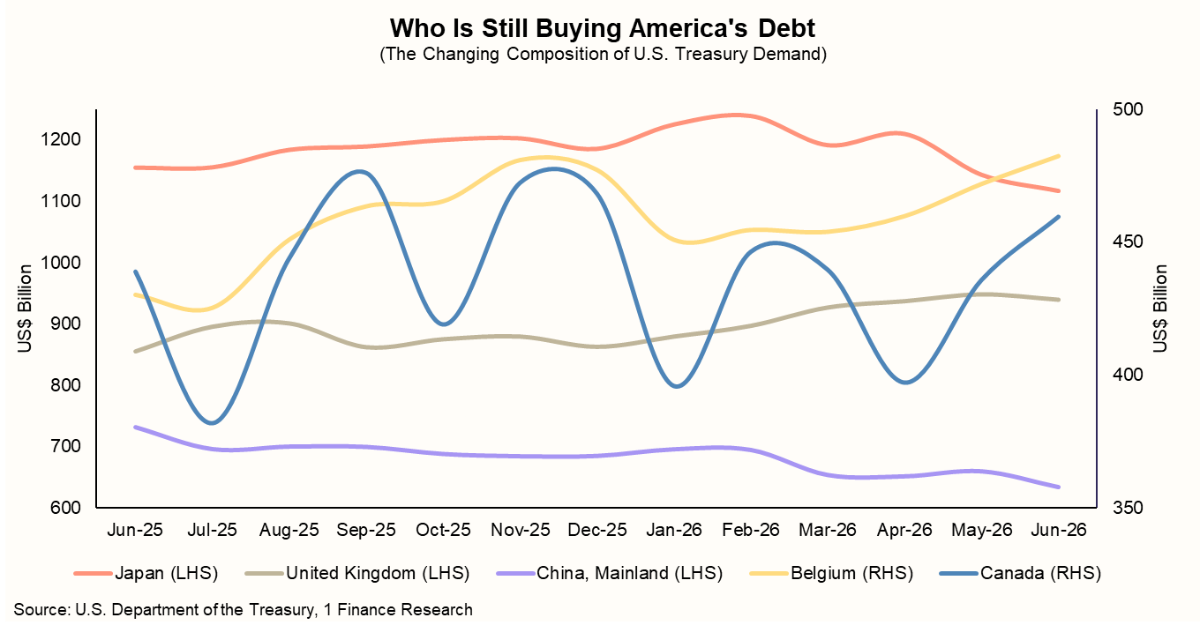
- Japan: Treasury holdings reversed after rising through late 2025, with the decline coinciding with sustained pressure on the yen. The shift appears more consistent with currency-management needs and the use of Treasury collateral through facilities such as the Fed's FIMA repo facility than a broader exit from US assets.
- Mainland China: Holdings continued their long-term downward trend, reflecting a gradual diversification away from heavy dollar concentration rather than a sudden reaction to short-term market developments.
- United Kingdom: Treasury holdings increased steadily, supported by elevated US yields. However, as London is a major global custody and financial centre, part of these holdings may reflect international investor flows routed through UK-based institutions.
- Belgium: Changes in holdings should be interpreted cautiously because Belgium hosts Euroclear, a major international securities settlement and custody hub. Movements therefore may represent reallocations by a wide range of global investors rather than changes in Belgian demand alone.
- Canada: Holdings fluctuated considerably over the period, suggesting that short-term movements may be influenced more by collateral, repo and settlement-related flows than by a sustained increase in long-term Treasury allocation.
Why Treasury Yields Keep Rising Even as the Fed Holds Rates
The Federal Reserve has held its policy rate at 3.50% to 3.75% since the start of 2026, yet Treasury yields moved anyway. Per the Fed's July 2026 Monetary Policy Report, the 2-year yield rose about 60 basis points this year while the 10-year rose only about 35, and by mid-August the long end was trading above 5%.
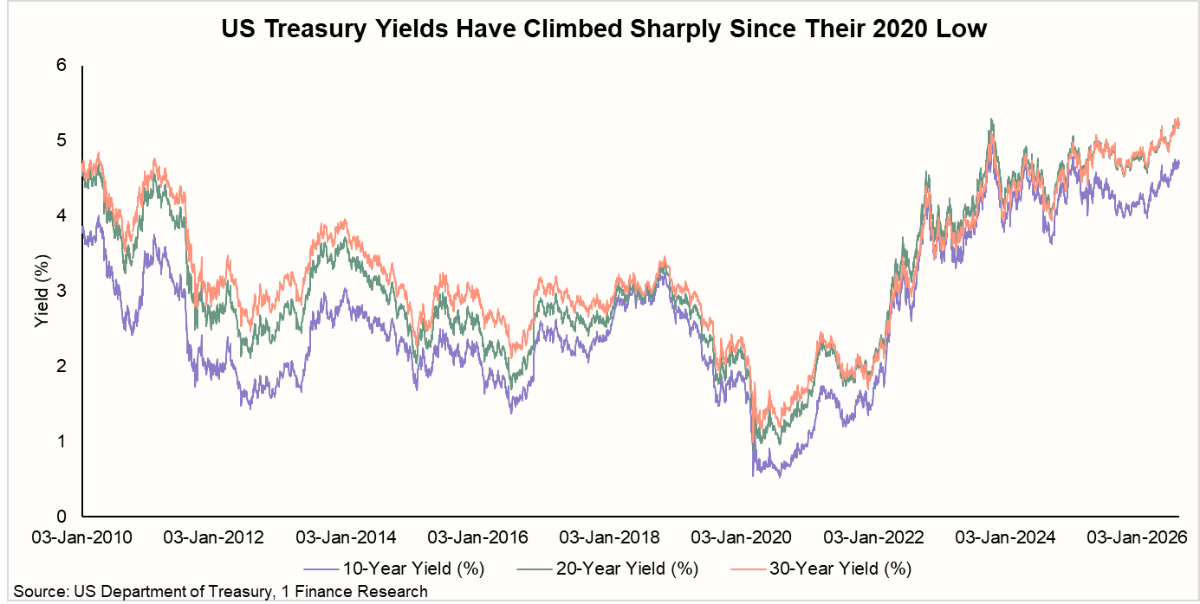
The sixteen-year view matters more than any single day's print. All three maturities bottomed together near 2020, the 10-year around 0.6%, before a sustained climb through 2022 to 2026 that has now erased the entire era of ultra-low long-term borrowing costs; both the 10-year and 30-year are back near where they stood in 2010.
The curve's shape adds a second layer. The 20-year and 30-year now sit on top of each other at 5.28%, while the 10-year trails at 4.71%, meaning the market demands almost no extra compensation to lend an additional ten years beyond the 20-year point; all the risk premium is loaded onto the belly and long end rather than spread evenly. A flat back end under a front end that's tracked a steady Fed rate is the signature of a market pricing Treasury supply, not future rate moves. If the Fed alone drove yields, a steady rate would keep the curve anchored; instead, the long end has drifted upward for years on its own, which is the stronger evidence that the sheer volume of debt being issued, not the Fed's next decision, is setting the price of US government borrowing.
The Dollar Is Not Behaving the Way Higher Yields Would Predict
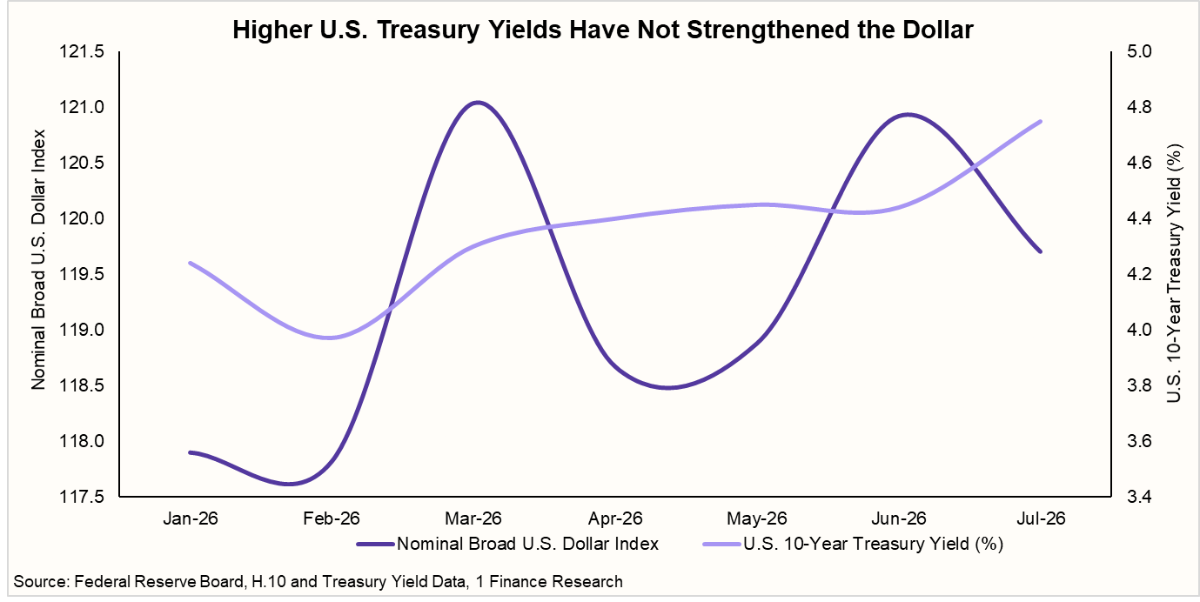
Higher Treasury yields normally pull foreign capital toward dollar assets and strengthen the dollar. That relationship broke down in August 2026: the Federal Reserve's Nominal Broad Dollar Index stood at 118.06 on August 21, down from 118.98 just three days earlier, even as long-term yields sat at multi-decade highs. The divergence signals that rising yields were being read as compensation for risk, not as a vote of confidence in US growth or tighter policy. When investors demand more return because of concerns over Treasury supply and persistent deficits, higher yields reflect rising risk, not rising demand for dollars.
The Treasury has responded with liquidity tools rather than trying to defend the yield level directly. On August 19, 2026, it said it would at least double the maximum size of buyback operations in the 10-to-20-year and 20-to-30-year sectors, from $2 billion to at least $4 billion per operation, aimed at supporting market functioning rather than targeting yields. The Fed's FIMA repo facility does similar work for foreign official holders, letting them raise dollars against Treasuries instead of selling them outright. Both cushion liquidity stress but neither removes the underlying risk of a sharper repricing if supply keeps outrunning demand.
Can the US Actually Repay This Debt
The US isn't repaying $40 trillion like a household clears a loan, and it doesn't need to. A sovereign borrowing in its own currency rolls debt over rather than retiring it, as long as buyers keep showing up.
Rollover risk, not default, is the live issue. Marketable debt's weighted average maturity is about 5.9 years, with roughly a third maturing within a year. Auction demand stays healthy, with bid-to-cover ratios above 2.0 across bills, notes and bonds in January 2026. The cost compounds: the average rate on total debt was 3.348%, while new 30-year issuance priced above 5%, so every rollover locks in a higher rate. CBO projects net interest rising from 3.3% of GDP in 2026 to 6.9% by 2056, and calls the trajectory unsustainable.
Outright default is narrow and political; dollar-denominated debt means the closer risk is a debt-ceiling standoff, not a shortfall. The realistic long-run risk is debasement, inflation eroding the debt's real value.
Why Hedge Funds Are a Hidden Risk in the Treasury Market
Hedge fund gross Treasury exposure doubled to $4.0 trillion between 2023 and September 2025, $2.4 trillion long and $1.6 trillion short, with their share of outstanding Treasuries rising from about 4.5% to 8.5%. The largest component is the Treasury cash-futures basis trade, buying Treasuries while shorting Treasury futures to capture small pricing gaps, which grew to roughly $830 billion by September 2025, about double its 2020 peak, and now accounts for 35% of hedge funds' long Treasury exposure.
The scale matters because the trade runs on leverage and short-term financing. A sudden volatility spike or funding disruption can force a fast, simultaneous unwind, a channel through which stress in one specialised strategy could spill into broader Treasury market volatility.
The Real Impact of US Debt on India
Everything traced through the earlier sections- rising term premiums, a foreign buyer base pulling back, a dollar decoupling from yields- doesn't stay contained to the US Treasury market. It reaches India through four distinct channels, some already visible in the data, some still building, and each one operates through a different part of the financial system.
1. Currency and Liquidity Conditions
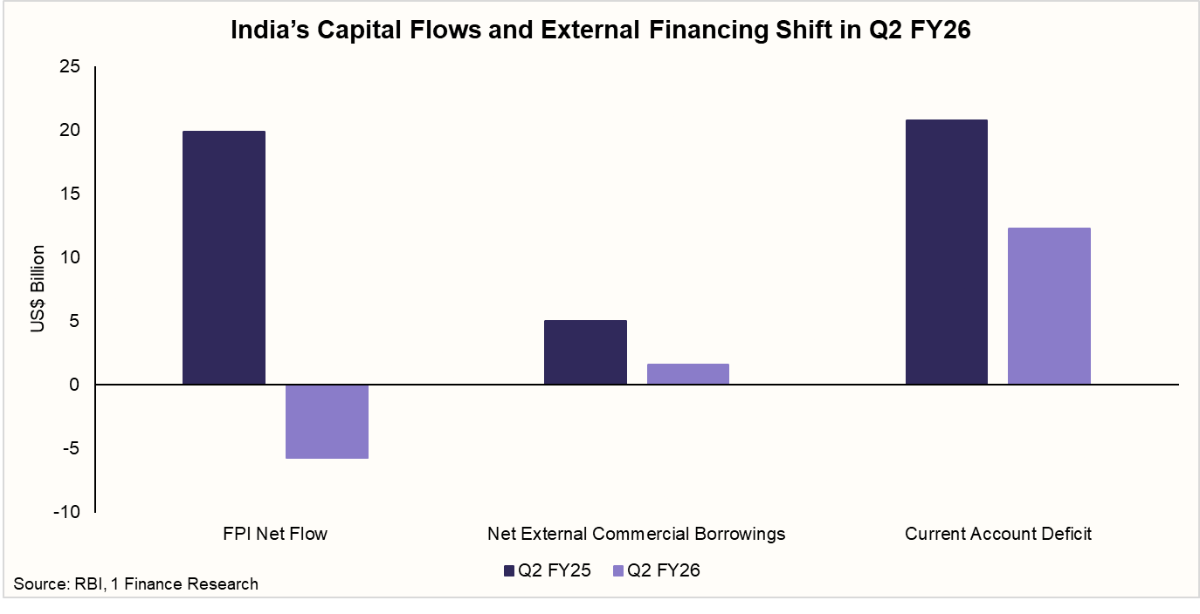
This channel shows the clearest, fastest-moving evidence, because portfolio capital is the most mobile part of India's external balance sheet and reacts to global conditions before trade or lending data catches up. In Q2 FY26, foreign portfolio investment swung to a $5.7 billion net outflow from a $19.9 billion inflow a year earlier, a reversal of more than $25 billion in a single year. Net external commercial borrowings moderated at the same time, to $1.6 billion from $5.0 billion, showing the pullback wasn't confined to equity and debt markets alone, foreign lenders pulled back too.
Reserves are what stand between that capital pullback and a disorderly currency move, and the past year shows both halves of how that buffer works. They fell from a ₹66,575.40 billion peak in January 2026 to ₹62,945.07 billion by June, a ₹3,630.33 billion drawdown, as the RBI sold dollars to slow the rupee's decline. They then rebuilt almost as fast, rising to ₹66,121.48 billion in July, a ₹3,176.41 billion rebound in one month.
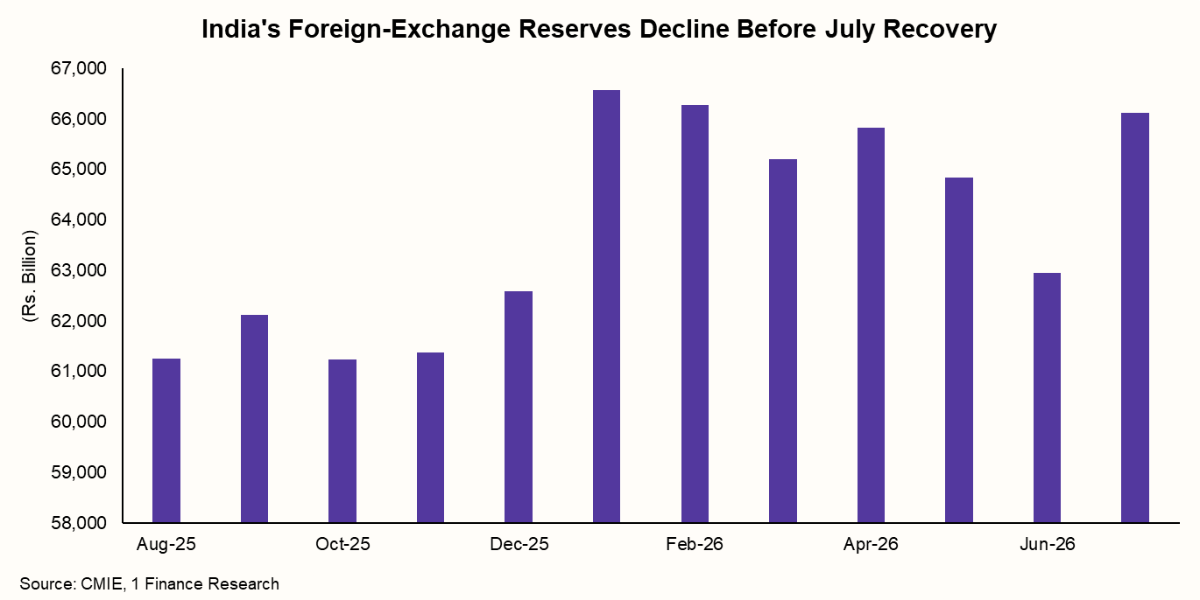
That July rebound is not reserves recovering on their own; it lines up almost exactly with the RBI's FCNR(B) swap facility launched that same week, covered in Channel 4 below, which pulled in fresh dollar inflows the RBI could then count toward reserves. Ahead of both the monthly BoP print and the weekly reserves data, the USD/INR forward premium is the earliest available signal in this channel, moving daily and pricing in currency stress before it shows up anywhere else.
2. Government Bond Market
India's G-sec market sits at the intersection of a global headwind and a domestic tailwind the government built on purpose. The headwind is direct: as US yields rise, the required return foreign investors expect from a comparable-duration Indian bond rises with it, since global capital prices sovereign debt relative to the US benchmark. The tailwind is policy: FPIs were exempted from tax on G-sec interest and capital gains from June 5, 2026, retroactive to April 1, and the Fully Accessible Route was widened to new 15, 30 and 40-year securities specifically to deepen the pool of foreign buyers this channel depends on.
| FPI holdings in Indian G-secs, as of May 12, 2026 | |
|---|---|
| Indicator | Figure |
| Total FPI holdings in G-secs | ₹3,75,171 crore |
| FPI holdings under FAR | ₹3,21,080 crore (6.74% of eligible stock) |
| FPI holdings under General Route | ₹54,091 crore (0.83% of stock) |
| Total outstanding G-secs | ₹112.42 lakh crore |
FAR holdings at 6.74% of eligible stock show real but still modest foreign penetration, meaning there's meaningful room for the tax exemption to pull in more capital, but also that India's own FY27 borrowing calendar has to be absorbed largely by the same domestic and foreign buyer base competing with rising global yields at the same time. Whether the tailwind outruns that combined pressure is the swing factor for Indian bond yields from here.
3. External Sector and Capital Flows
India's external sector remains vulnerable to changes in global commodity prices and the rupee because oil and gold are major imports and are largely priced in dollars. The chart below shows that imports remained consistently higher than exports from January to June 2026, keeping pressure on India's merchandise trade balance. The gap widened notably in April and May, highlighting the continued dependence on imports.
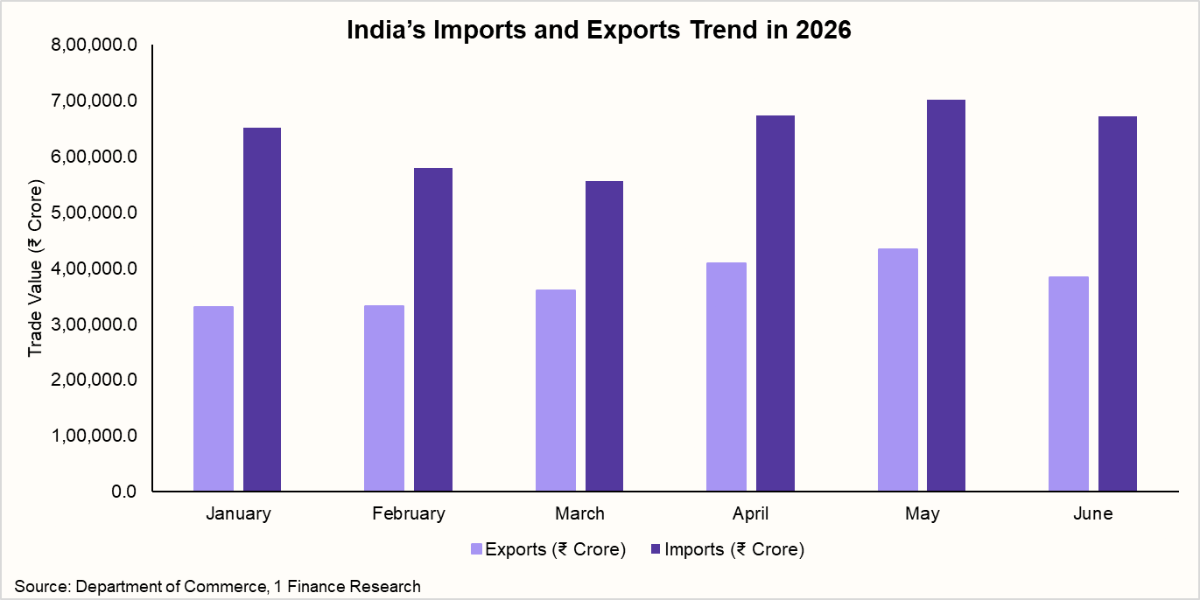
A wider merchandise trade deficit does not automatically translate into an equally large current account deficit, as India's services surplus and remittance inflows offset part of the gap. This is reflected in the current account deficit, which stood at 1.3% of GDP in Q2 FY26.
Another risk comes from trade policy. US tariffs linked to India's purchases of Russian oil increased from 25% to a combined 50% between August 2025 and February 2026, before later settling at an 18% reciprocal rate after India committed to halt those purchases. Such policy changes could affect India's export earnings independently of movements in global yields or capital flows.
4. Corporate and Banking System
Higher US Treasury yields can increase overseas borrowing costs for Indian banks and corporations. As global interest rates rise, instruments such as External Commercial Borrowings (ECBs) and other foreign-currency funding become more expensive.
The RBI's June 2026 swap facility helped ease this pressure, attracting $56.85 billion in cumulative inflows by August 13, with FCNR(B) deposits accounting for $52.30 billion. This shows how rising global funding costs can directly affect India's banking and corporate sectors, requiring policy support to manage external financing pressures.
What to Monitor Beyond the Headline
| Key indicators to track, US and India side | ||
|---|---|---|
| Indicator | Latest figure | Signals |
| Foreign UST holdings | $9.3 trillion, Jun 2026 | US demand direction |
| 10Y / 30Y UST yields | 4.71% / 5.28%, Aug 18 | Long-end financing pressure |
| Broad Dollar Index (DTWEXBGS) | 118.06, Aug 21 | Whether the dollar tracks yields |
| FPI debt flows into India | -$5.7bn, Q2 FY26 | Direction of foreign capital |
| India-US 10Y spread | Monitor continuously | Relative bond appeal |
| RBI forex reserves | ₹66.12 lakh crore, Jul 2026 | India's shock absorber |
| Merchandise trade deficit | $28.4bn, Apr 2026 | Oil/gold pressure |
| USD/INR forward premium | Monitor daily, all tenors | Earliest currency-stress signal |
What This Means for Investors and Advisors
For investors: NRI deposit decisions should be judged on the underlying rate, not the RBI's swap subsidy, which closes to fresh FCNR(B) deposits on August 31, 2026. Debt fund allocations weigh a real domestic tailwind (tax exemption, index inclusion) against a genuine global headwind. Gold is a complicated hedge here; its own price rise is adding to the trade deficit it's supposed to protect against.
For advisors, four triggers: a sustained rise in US long yields (flag duration risk), a reversal into FPI debt outflows (the fastest domestic signal), a narrowing India-US 10Y spread, and reminding dollar-liability clients that the RBI subsidy is time-bound, not permanent. Watch three things next: the next US debt-ceiling deadline, since that's the closest the US comes to an actual default event; the RBI's upcoming policy review, for signs of how it balances the trilemma once the FCNR(B) window closes; and India's Q2 FY27 current account print, the first full read after this cycle's capital flow reversal.
Conclusion
$40 trillion is a legacy number. The live story is whether Treasury demand keeps absorbing new issuance without a sharp yield jump, and how that financing constraint, not the debt stock itself, travels through India's capital flows, its bond market, the rupee, and the cost of capital for Indian companies.