India’s banking system just posted its best health checkup in decades, gross bad loans at a multi - decadal low of 1.8%, capital buffers at record highs, and profits crossing ₹4 Lakh Crore. So why is the Reserve Bank of India still sounding a note of caution?
The answer lies not in the banks, but in the people borrowing from them.
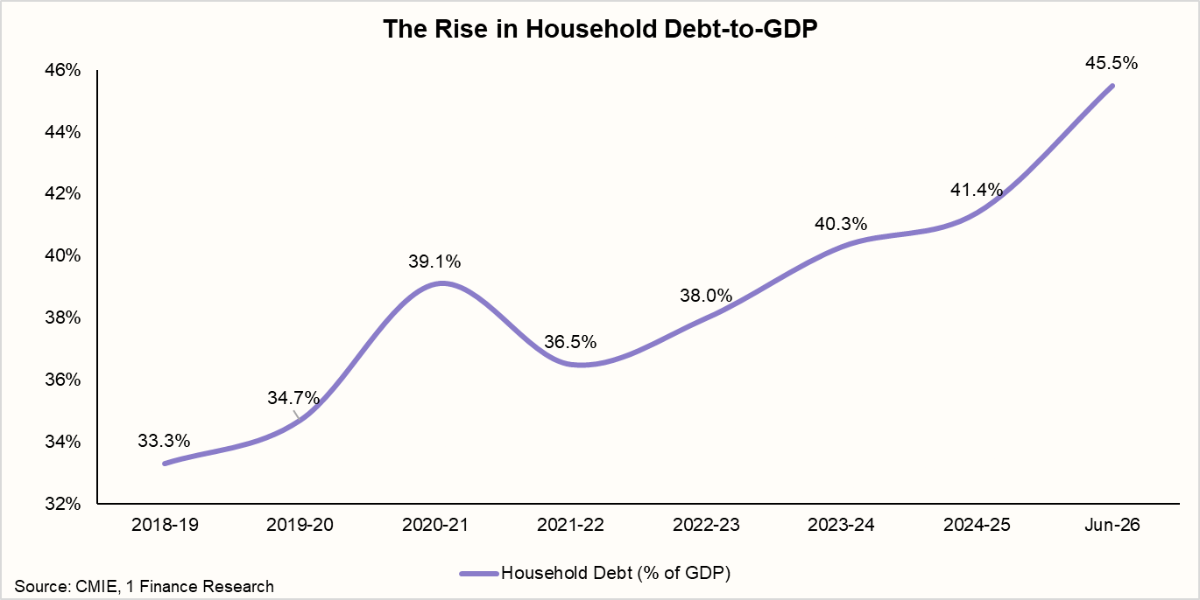
According to RBI's Financial Stability Report for June 2026, household debt in India has climbed to 45.5% of GDP, and more tellingly, the kind of debt households are taking on has shifted toward unsecured, income-dependent borrowing rather than asset-backed loans like housing. It's a shift that's been building for years, and one that RBI believes deserves closer attention before it becomes a bigger problem.
In this piece, we break down what's changed in household finances over the past two decades, what the June 2026 report actually says, who's borrowing and why, and what it could mean for the road ahead.
India's Household Finances Over 20 Years
Indian household finances over the last two decades have moved through five distinct phases, each shaped by a major economic event.
| Household Debt Growth, Phase by Phase (2004-2024) | ||
|---|---|---|
| Period | Phase | What Happened |
| 2004-08 | Boom, then bust | Strong household borrowing was driven by post-liberalisation credit expansion, reversing sharply with the 2007-08 global financial crisis as credit tightened worldwide and liabilities growth crashed into negative territory. |
| 2009-16 | A quiet, stable stretch | Debt growth recovered to a smaller peak around 2010-11, then settled into nearly six years of low-double-digit growth, also the steadiest period for net financial savings as a share of GDP. |
| 2017-18 | The demonetisation/GST spike | Household debt growth surged sharply, though not purely from new borrowing. Demonetisation and the GST rollout pushed previously informal, undocumented credit into the formal banking system, inflating the recorded numbers. |
| 2020-21 | The COVID pause | Liabilities growth flattened and briefly turned negative as lockdowns froze spending and borrowing, the same period that produced a temporary spike in precautionary household savings. |
| 2021-23 | The sharpest borrowing surge on record | Debt growth peaked in 2022-23 at the steepest climb of the entire 20-year window, outpacing even 2017-18. Unlike past booms, savings didn't rise alongside debt this time; net financial savings stayed low and flat through the surge. |
| 2023-24 | Cooling debt, no savings rebound | Borrowing growth eased sharply, but net financial savings didn't bounce back, still holding well below where it sat through most of the 2000s and 2010s. |
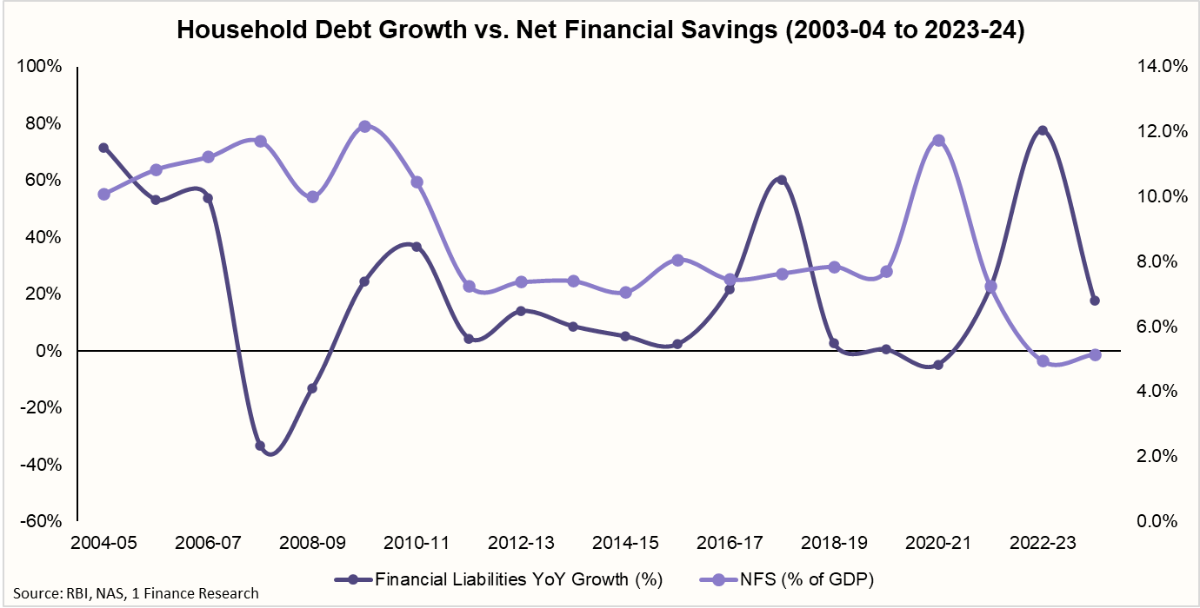
The chart below plots both trends together across the full 20-year window: household debt growth as the volatile line, spiking and crashing around each major economic event, against net financial savings as the steadier line, one that stays fairly flat through the 2010s, dips through the pandemic years, and never fully recovers even after the 2022-23 debt surge cools off. It's this exact gap, debt outrunning savings, with no real rebound in the cushion households have to fall back on, that sets up the concerns RBI raises in its June 2026 Financial Stability Report, covered next.
What the RBI's Financial Stability Report June 2026 Says About India
RBIs Financial Stability Report, released June 30, 2026, paints a picture of contrasts. India's banking system looks stronger than it has in decades, gross NPAs at a multi-decadal low of 1.8%, capital adequacy at record highs (CRAR 17.7%, CET1 15.3%), and bank profits crossing ₹4 lakh crore for the first time. But buried in the same report is a clear warning about households.
The core number: Household debt now stands at 45.5% of GDP, modest by global standards, but part of a steady upward trend RBI has flagged across several report cycles.
Recommended for you
Readers also explored
India’s Macroeconomic Outlook for 2025: Embracing Recovery and Global Shifts
 6 min read
World GDP Breakdown 2025: Who Powers the Global Economy?
8 min read
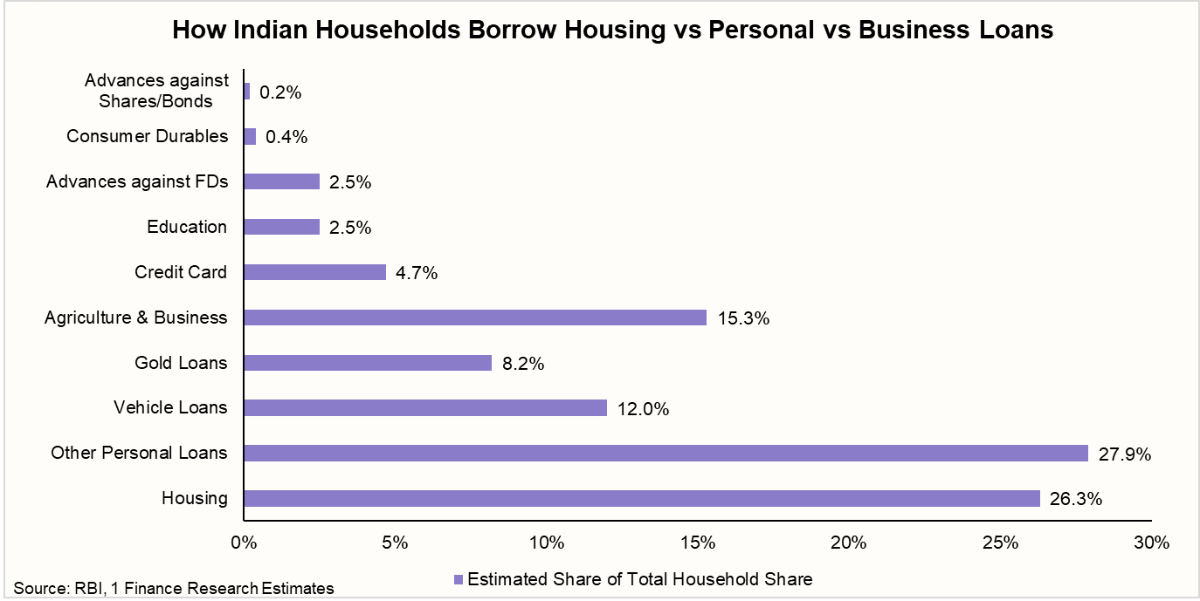
What's driving it: The growth isn't coming from housing loans. Non-housing retail loans now make up 58.4% of household borrowing, consistently outpacing housing, agriculture, and business lending, with consumption loans alone accounting for nearly half of all household debt. RBI's concern: housing debt is asset-backed and tied to income growth, while unsecured consumption debt depends much more directly on income holding steady.
Today's numbers still look fine, for now: Gross NPAs sit at just 0.7% for secured retail loans and 1.7% for unsecured retail loans. But RBI is explicit that these are backwards-looking figures, reassuring today, but not predictive, given how much the composition of debt has shifted toward income-sensitive lending.
How Indian Households Borrow and Who Is Borrowing
India's household debt isn't just growing, it's changing shape, and that shift is what makes the climb charted in Section 2 worth paying attention to.
- The shift away from housing: Housing loans used to be the backbone of household debt, asset-backed, tied to income growth, relatively low-risk by design. That's no longer the dominant story. Non-housing retail loans now make up 58.4% of total household borrowing, a share that's been rising steadily and consistently outpacing housing, agriculture, and business lending, with consumption loans alone accounting for nearly half of all household debt. The distinction matters: housing debt is collateralised and scales with long-term income, while unsecured debt depends directly on income holding up in the near term, with nothing to fall back on if it doesn't.
- Gold loans, the fastest-growing category: Gold-backed loans are the standout within non-housing retail debt, growing at a 42.4% compounded annual rate since March 2024, with outstanding gold loans hitting ₹5.14 trillion by May 2026. Much of this is repeat borrowers leveraging rising gold prices for more credit, relatively well-protected for now, but effectively a concentrated bet on gold prices staying elevated. A sharp correction would weaken that collateral cushion fast.
- Fintech lending and the multi-lender risk: Fintech-driven lending grew 36.1%, and RBI flagged rising impairment among borrowers who've taken unsecured loans from five or more lenders at once. This "stacking" pattern is risky, less because of the total debt held, and more because of how fragmented it is; stress on one loan can cascade across the others. Fintech-sourced borrowers, typically with smaller ticket sizes and faster disbursal, are especially prone to this.
- Secured vs. unsecured, the fragility gap shows up in the data: Gross NPAs sit at 0.7% for secured retail loans versus 1.7% for unsecured, more than double. Secured borrowers, largely housing loan holders, have collateral and stronger income profiles behind them; unsecured borrowers carry more risk per rupee lent, even before the stacking problem above.
- Income-level resilience: The FSR's Box 1.2, "Borrower Resilience – Income Level Analysis," is RBI's most direct attempt to identify which income segments are carrying the most fragile debt, likely pointing to whether lower- or middle-income borrowers are disproportionately exposed to the unsecured lending boom.
Together, these numbers explain the mechanics behind Section 2's debt-to-GDP climb: households aren't just borrowing more, they're borrowing, and being borrowed from, in ways that leave them more exposed if the economy turns. The next section turns to the other side of the balance sheet: how savings behaviour has been shifting alongside this borrowing pattern.
Where Indian Households Are Putting Their Savings
Households are shifting money out of CASA, banks' cheapest funding source, into equities and mutual funds. RBI calls it structural, not a blip.
To offset this, banks are leaning on costlier term deposits and CDs, raising their cost of funds. Some are pushing higher-yield lending, like small business loans, to protect margins.
The scale shows in the data: mutual fund folios grew from 4.2 crore (FY15) to 23.5 crore (FY25), a ~19% CAGR. Demat accounts rose from 4 crore to 19.1 crore, with 4.6 crore added in 2024 alone.
The chart tracks this within gross financial savings since 2011-12. Deposits fell from 58% to 40% (with a 2016-17 demonetization spike), while Provident & Pension Funds, Insurance Funds, and Shares & Debentures have all steadily gained share.
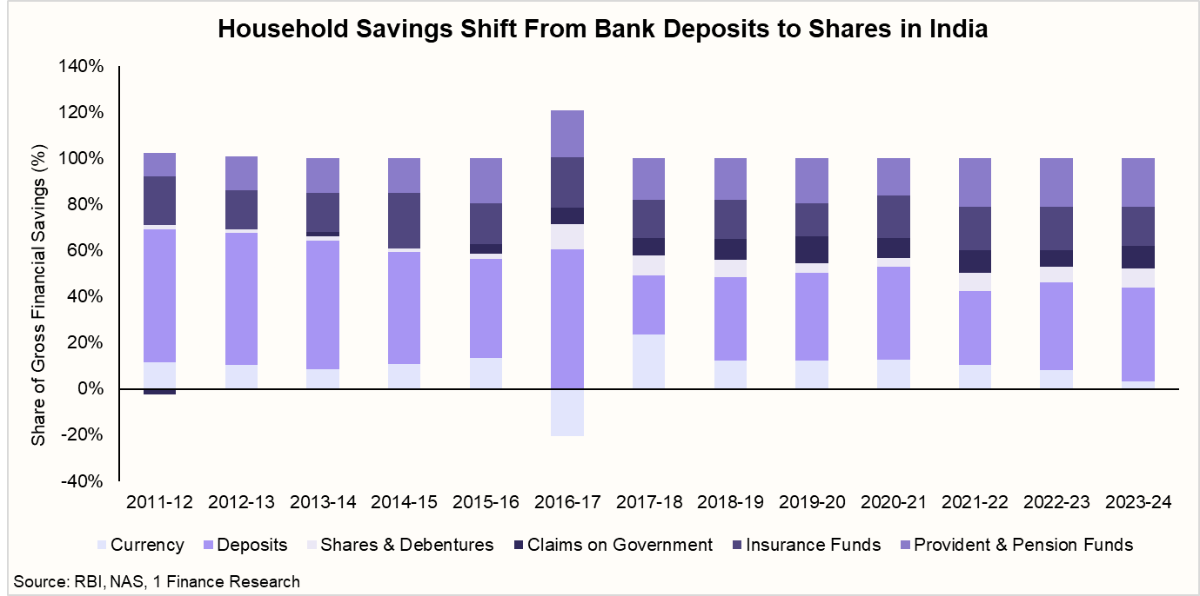
Provisional estimates for 2024-25 suggest this shift has only accelerated. Deposits' share is estimated to have fallen further, to around 35% of gross financial savings, while Shares & Debentures appear to have jumped sharply, from an average of roughly 6% across the decade to an estimated 15% in 2024-25 alone. Net financial savings also improved to somewhere between 6-7% of GDP, up from 5.1% the year before, while household financial liabilities eased to around 4.8% of GNDI. Full instrument-wise detail for 2024-25 isn't yet available in RBI's official data releases, but the direction is unambiguous: households are continuing to move away from low-yield bank deposits and toward market-linked investments, even as their overall borrowing pressure shows early signs of easing.
RBIs Concerns About India's Economic Outlook
Everything covered so far, rising debt-to-GDP, a shift toward unsecured borrowing, and savings moving out of safe deposits, would matter less if the broader economy were on a stable footing. It isn't quite.
Global conditions have already tightened once this year: Conflict in West Asia pushed global financial conditions tighter earlier in 2026. Markets have since recovered, aided by optimism around artificial intelligence, but RBI notes that domestic stability remains contained despite this global uncertainty, not because the underlying risks are gone. Bond market fragilities, elevated asset valuations, and the growing role of non-bank financial intermediaries globally could all amplify the next shock.
Oil and commodity prices connect directly to household stress: RBI links elevated oil and commodity prices, along with weaker global growth, to real downside risk, and it's households carrying unsecured, income-dependent debt who have the least room to absorb that squeeze.
Inflation could test RBI's comfort zone: Conflict-driven supply shocks plus the risk of a weak monsoon could push headline inflation close to 6% in Q3 FY27, precisely the kind of shock that turns manageable EMIs into missed payments for stretched borrowers.
Recovery is real, but not the whole story: High-frequency indicators through April-May 2026 show growth staying firm in Q1 FY27. RBI isn't predicting a downturn; it's naming the specific pressure points (oil, global growth, inflation, monsoon) that could turn today's "resilient but exposed" household sector fragile if several go wrong at once.
Read together, this is the backdrop against which RBI's household warnings matter: income-dependent debt, thinner savings cushions, and live macro risks that could squeeze the very income these borrowers depend on.
What Happens Next for India's Household Debt
If the earlier sections explain where things stand today, this one is about what would actually move the needle, the specific indicators worth tracking over the next few quarters.
| Key Indicators to watch through FY27 | |
|---|---|
| Indicator | Why It Matters |
| December 2026 FSR | Will show whether household debt-to-GDP kept climbing past 45.5%, or whether liabilities growth (already down to 17.7% by 2023-24) continues to cool, the most direct read on whether things are easing or deepening. |
| Gold prices | Gold loans are the fastest-growing category of household debt, and their safety currently rests on elevated prices holding up. A sharp correction would directly weaken collateral cover for a large, fast-growing borrower pool. |
| Q3 FY27 inflation prints | Will show whether the RBIs flagged risk, inflation approaching 6%, is materialising, or whether the benign scenario holds instead. |
| Multi-lender fintech borrowing data | Worth watching for either tighter regulatory norms or early signs of delinquency, given RBI's specific flag on borrowers stacked across five-plus lenders. |
| Bank deposit and CASA trends | Continued outflows push up banks' cost of funds, potentially tightening lending standards or pushing banks further into higher-yield, higher-risk lending, looping back into the household borrowing story itself. |
| Monsoon performance | One of two specific triggers RBI is named for a possible inflation spike and a near-term, observable signal worth watching through the rest of the season. |
None of these alone would flip India's financial system from resilient to unstable. But RBIs' own framing is clear: resilience today doesn't preclude vulnerabilities building underneath, and these are the threads where that vulnerability would show up first.
What Investors and Advisors Should Do Now
For investors, the household debt story isn't just a macro data point; it has direct implications for portfolio decisions and financial planning conversations happening right now.
Reassess exposure to unsecured lending and gold-loan NBFCs. Given RBI's specific flags around unsecured retail credit and gold-loan concentration, investors holding exposure to NBFCs and lenders heavily skewed toward these segments should weigh that risk explicitly, not because a crisis is imminent, but because the sector's earnings quality depends on gold prices and borrower income holding steady, both of which the FSR flags as live risks.
Rising debt-to-GDP is a reason to revisit personal leverage, not just watch it as a headline number. If a client's own borrowing mirrors the trend this report describes, more consumption-linked, unsecured debt relative to income, this is a natural, low-pressure moment to review that exposure before any macro shock actually arrives, rather than after.
The savings shift is an opportunity, but it needs to be intentional, not passive. Households are moving money out of low-yield deposits and into equities, mutual funds, and retirement products, but RBI's own data shows this shift accelerating fastest in periods (like right after COVID) when it was driven more by circumstance than planning. Advisors are well placed to help clients make this same shift deliberately, aligned to actual goals and risk appetite, rather than simply following the broader trend.
Bank funding costs are a signal worth watching for fixed-income allocation. As banks lean more on costlier term deposits and CDs to replace shrinking CASA balances, this can translate into better deposit rates for savers in the near term, a small but real tailwind worth factoring into short-term debt allocation decisions.
For advisors specifically, this report is a useful, low-friction conversation starter. Rather than framing household debt as an abstract risk, it's a concrete opening to review a client's own debt composition (secured vs. unsecured), check whether they're inadvertently part of the "multi-lender" pattern RBI flags, and revisit how much of their savings still sits in low-yield instruments relative to their actual financial goals and time horizon.
None of this calls for alarm, RBIs own framing is watchfulness, not warning. But the report gives investors and advisors a genuinely useful, data-backed reason to have conversations about debt and savings composition that are often easy to postpone until something forces the issue.
Conclusion and Outlook
Pull back far enough, and this report isn't really about a single number; it's about household debt and savings moving in opposite directions at once. A borrowing surge that outran savings growth in 2022-23 hasn't fully reversed, unsecured debt has become the dominant driver of household borrowing, and the savings cushion that would normally absorb a shock keeps thinning even as more of it moves into market-linked instruments.
None of these points leads to a crisis. Banks and NBFCs remain well-capitalised, asset quality is strong, and RBI's own tone is watchfulness, not alarm, but it's explicit about where that watching needs to happen: household leverage, funding costs, and borrower resilience if inflation, oil prices, or a weak monsoon push income under pressure.
The December 2026 FSR will be the first real test of which way this goes: a continued cooldown in borrowing and a savings recovery, or the macro risks RBI has flagged converging on exactly the income-sensitive debt that's grown fastest in recent years. Either way, the households at the centre of this story aren't just watching from the sidelines; what they borrow and save next will help decide the outcome.